PERT Chart vs Gantt Chart – Key Differences & When to Use Each
Discover the key differences between a PERT chart vs Gantt chart. Learn their pros, cons, and when to use each for effective project management in 2025.
Choosing between a PERT chart vs Gantt chart can shape your project’s success. Both are powerful project management tools, but they serve different purposes: PERT charts tackle uncertainty and dependencies, while Gantt charts provide a clear timeline for tracking progress. Not sure which to use? We’ll compare them head-to-head to help you decide. For more on Gantt charts, explore our Gantt Chart Definition and Complete Guide. Let’s break down the PERT chart vs Gantt chart debate!
Key Takeaways
- Explore the strengths of PERT charts for managing complex, uncertain projects like research or new product development, where time estimation and task dependencies are critical.
- Understand Gantt charts’ simplicity as a go-to for clear scheduling and progress tracking in projects like construction or marketing campaigns with defined timelines.
- Compare visualization differences to choose wisely: PERT’s network diagrams highlight task sequencing, while Gantt’s bar charts offer an at-a-glance timeline view.
- Leverage TaskFord’s Gantt features—like drag-and-drop scheduling and milestone tracking—to streamline planning and adapt to any project type effortlessly.
What is a PERT Chart?
Definition and Purpose of a PERT Chart
PERT, or Program Evaluation and Review Technique, is a method designed to analyze task dependencies and estimate project duration. Unlike other tools, it thrives on handling uncertainty, making it ideal for projects where timelines aren’t set in stone. By mapping out tasks and their relationships, a PERT chart helps managers predict completion times and identify potential delays - perfect for planning with precision under unpredictable conditions.
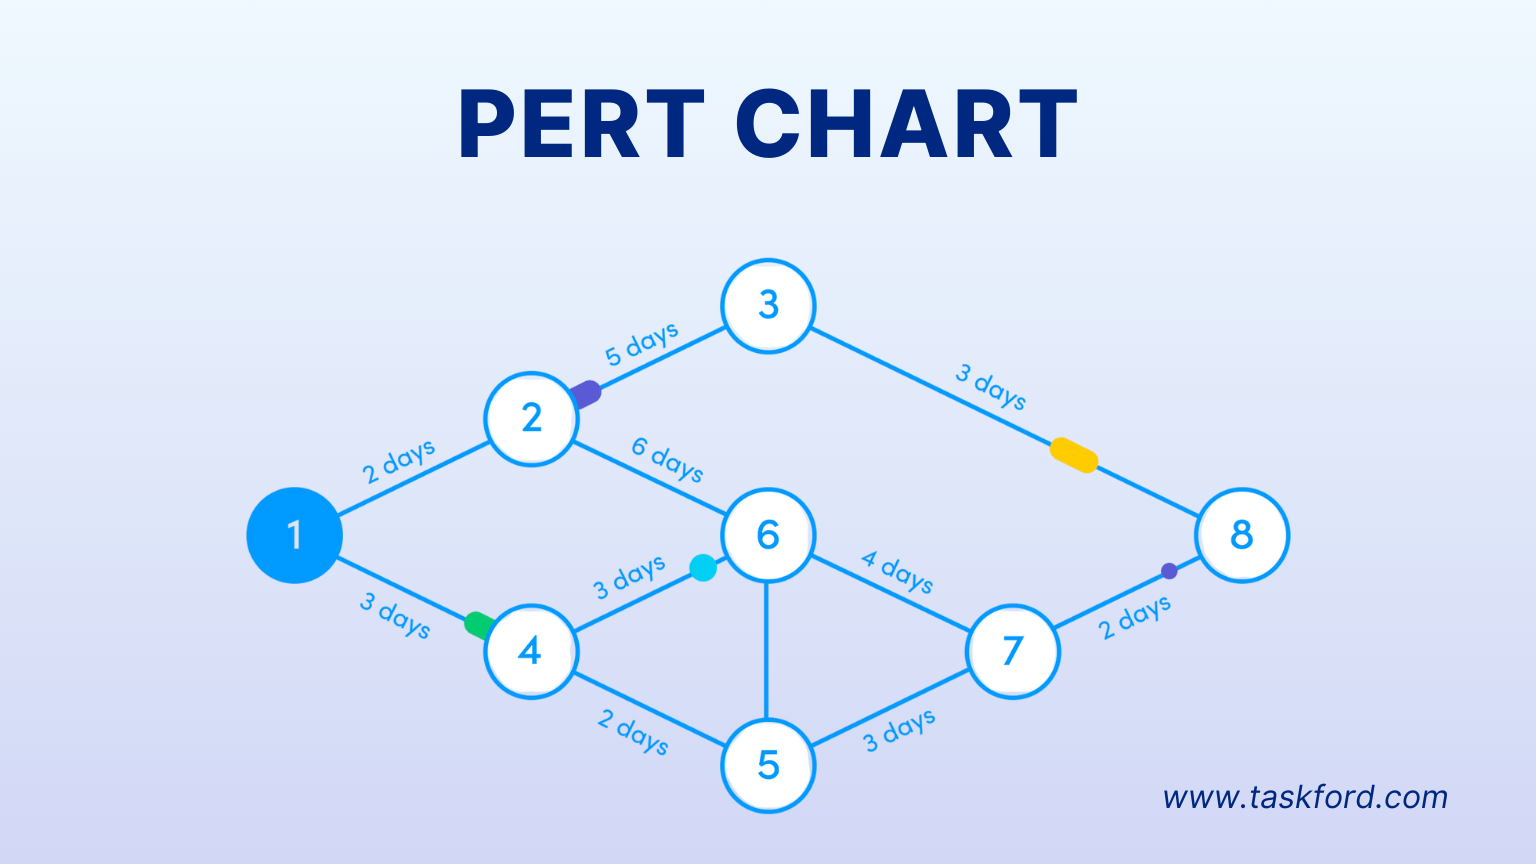
Key Features of a PERT Chart
A PERT chart comes with distinct features that set it apart:
- Nodes: Represent tasks or milestones.
- Arrows: Show dependencies between tasks.
- Critical Path: Highlights the longest sequence of tasks determining project duration.
- Time Estimates: Uses three figures—optimistic, pessimistic, and most likely—to calculate durations.
For example, "Unlike a Gantt chart, a PERT chart emphasizes task sequencing," focusing on how tasks connect rather than just when they happen.
Pros and Cons of a PERT Chart
Like any tool, PERT charts have strengths and weaknesses:
- Pros: Excels at managing complex projects with uncertainty (e.g., R&D). It pinpoints critical tasks that impact timelines, offering clarity in chaos.
- Cons: Creating and updating it can be time-consuming. Its complexity might overwhelm beginners or small teams needing simpler solutions.
In the PERT chart vs Gantt chart debate, these traits make PERT a niche but valuable choice for specific needs.
What is a Gantt Chart?
Definition and Purpose of a Gantt Chart
A Gantt chart is a visual timeline that tracks tasks, deadlines, and progress in one glance. It’s built to help teams plan projects, assign responsibilities, and monitor how work unfolds over time. Whether you’re managing a small campaign or a large construction project, its straightforward design keeps everyone aligned. Want a deeper dive? Learn more in What is a Gantt Chart? Everything You Need to Know in 2025.
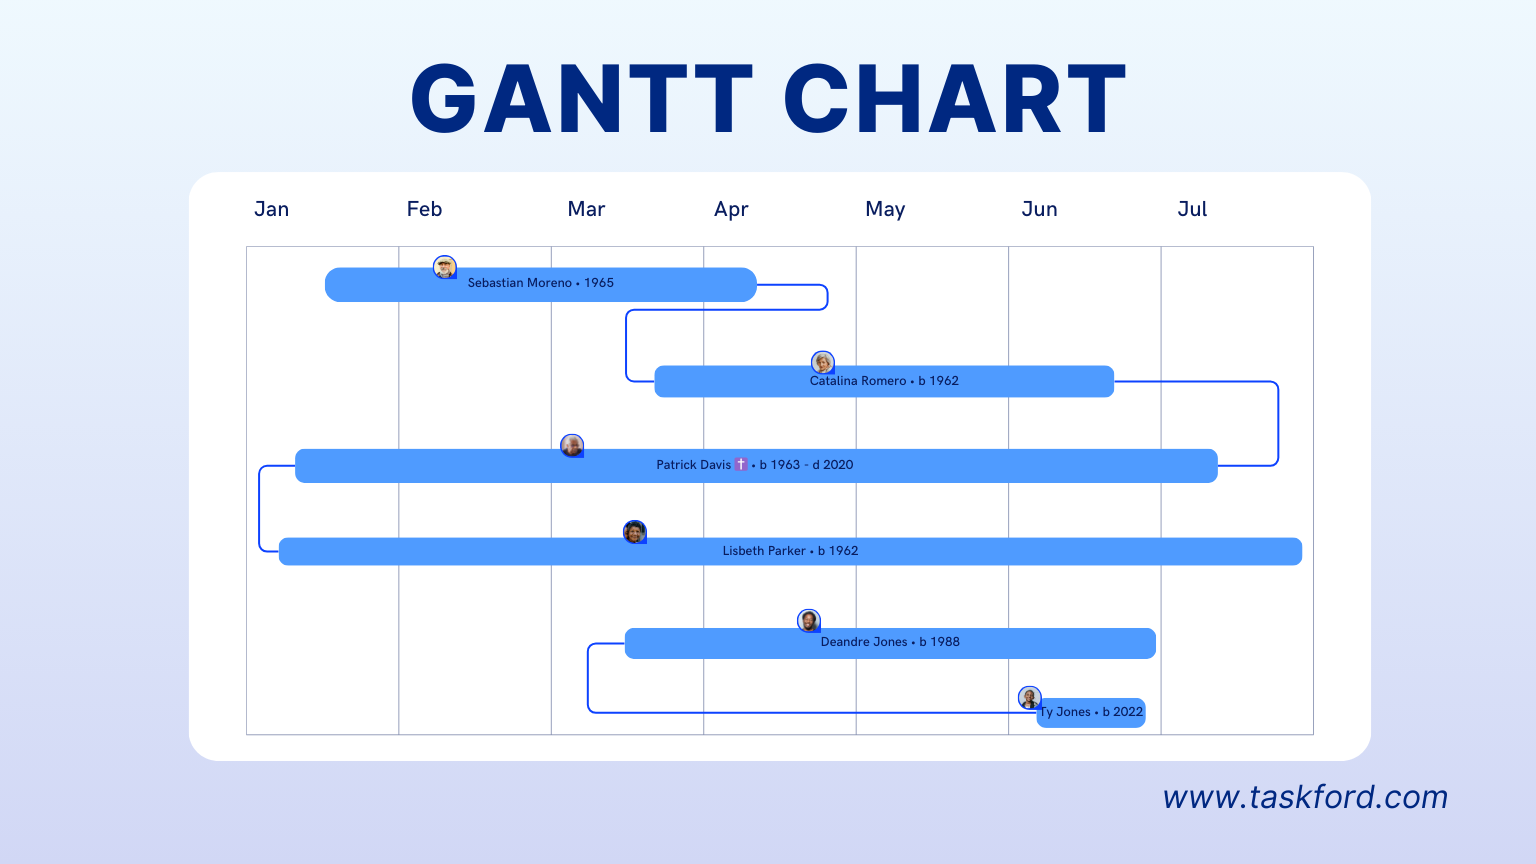
Key Features of a Gantt Chart
Gantt charts stand out with these core elements:
- Horizontal Bars: Represent tasks and their duration.
- Milestones: Mark key deadlines or achievements.
- Dependencies: Show how tasks link together.
- Resource Allocation: Tracks who’s doing what.
For example, "A Gantt chart excels at showing project schedules clearly," making it a go-to for visual planning.
Pros and Cons of a Gantt Chart
Here’s where Gantt charts shine—and stumble:
- Pros: Easy to read and widely adopted, it’s perfect for straightforward scheduling and team coordination.
- Cons: It struggles with time estimation for uncertain projects, lacking the depth of a PERT chart in complex scenarios.
In the PERT chart vs Gantt chart showdown, Gantt’s simplicity often wins for everyday use.
PERT Chart vs Gantt Chart: Key Differences
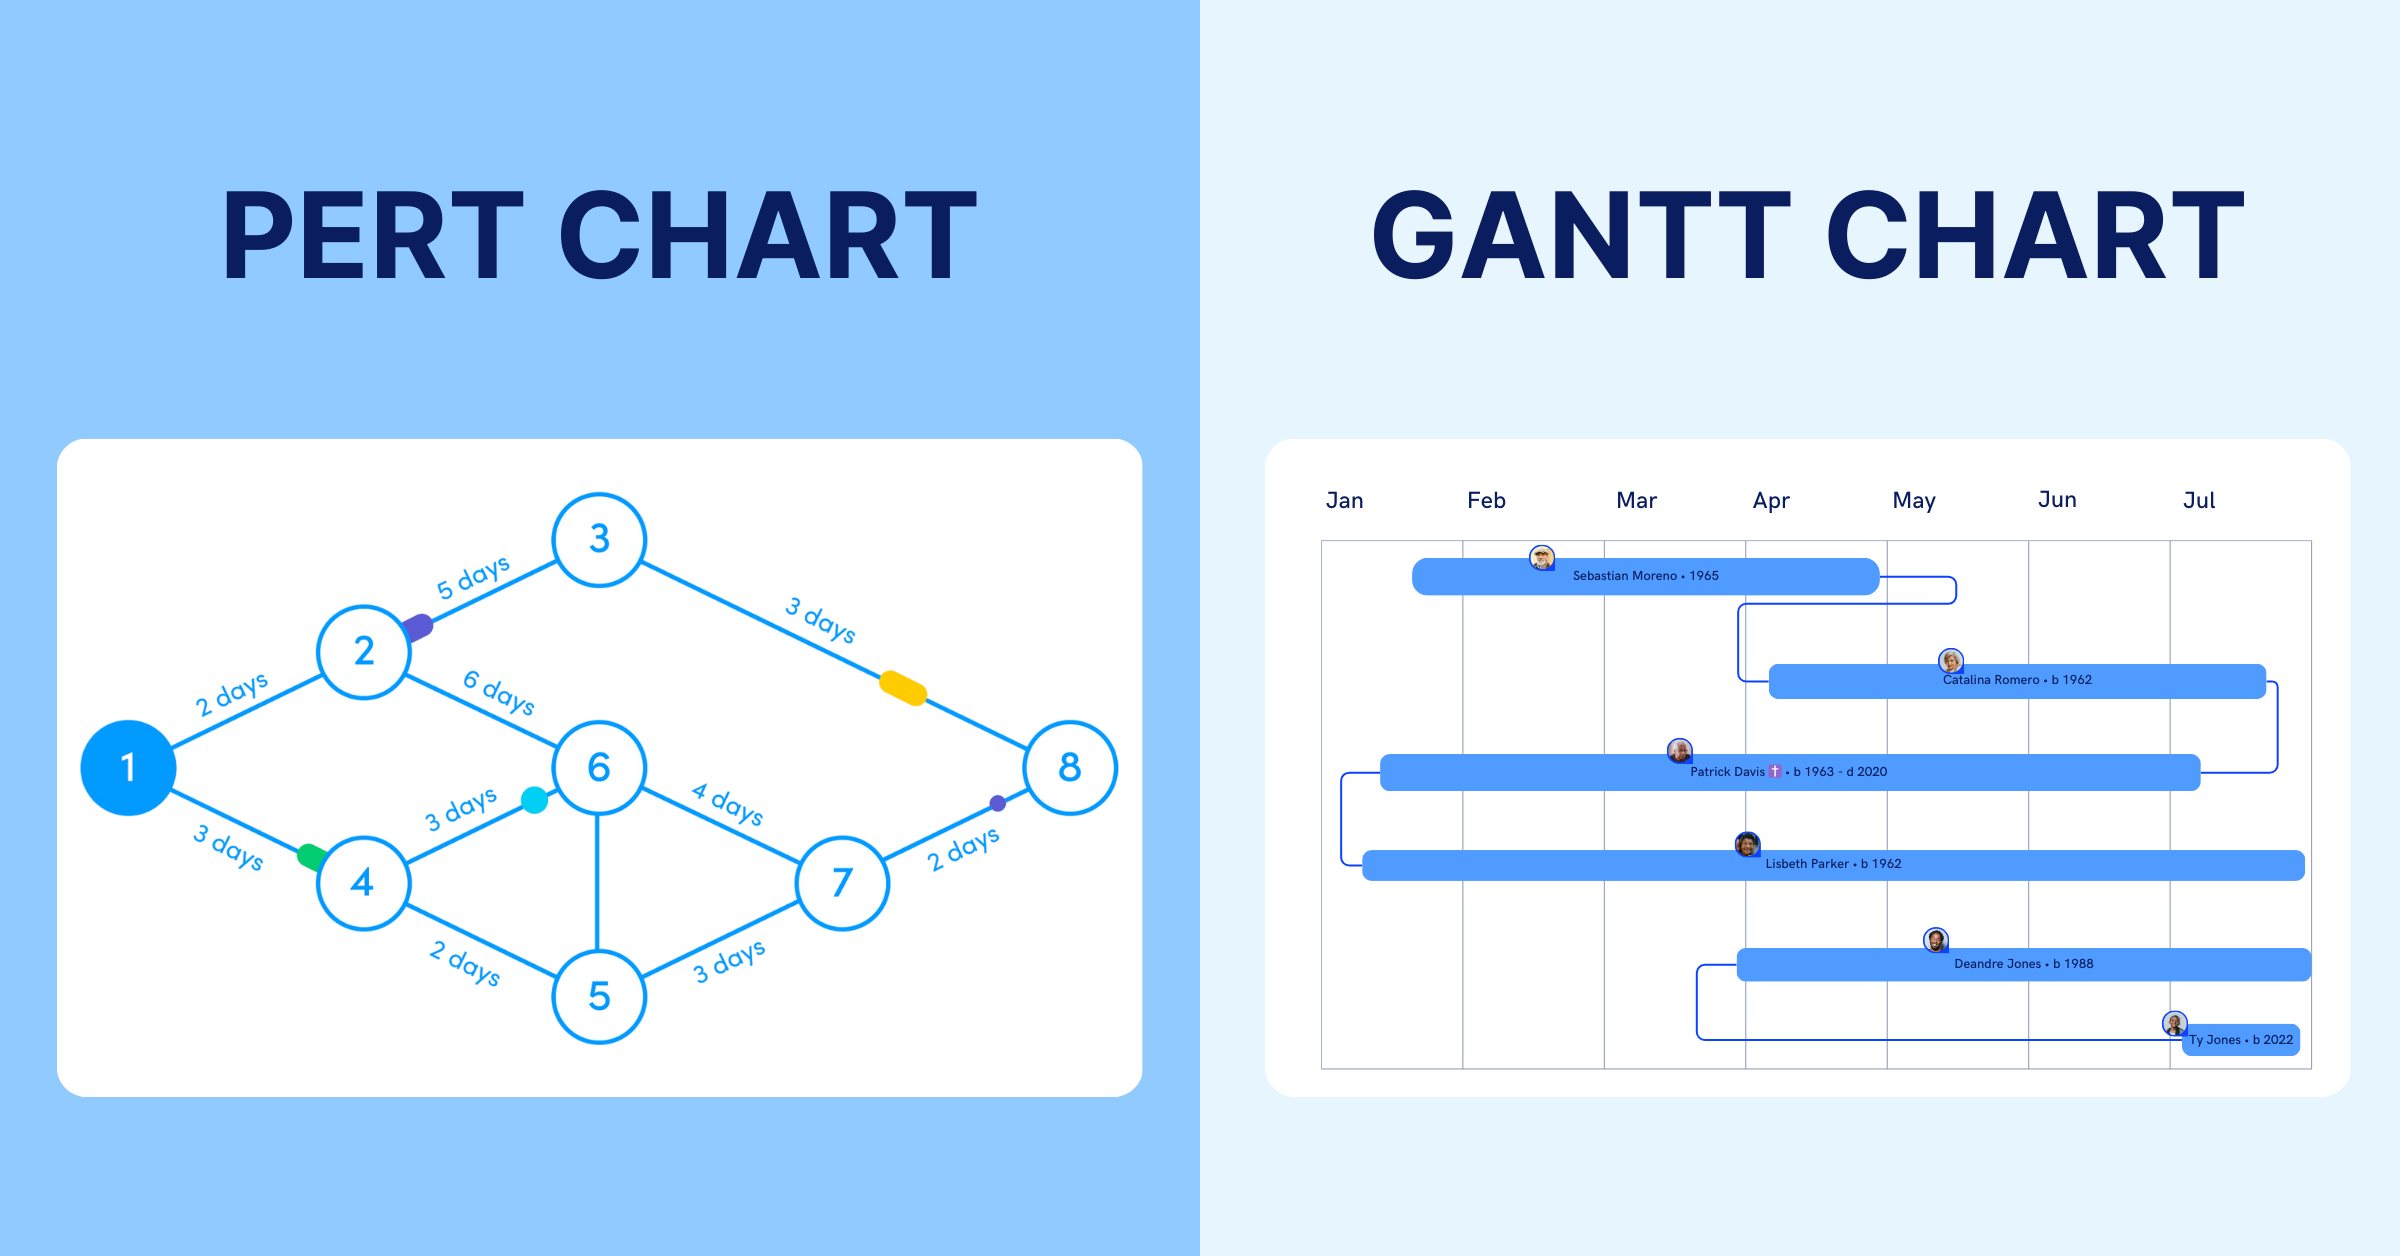
When choosing between a PERT chart vs Gantt chart, understanding their core differences is crucial. Below, we break down how they differ in structure, focus, and usability - complete with a handy comparison table to make it crystal clear.
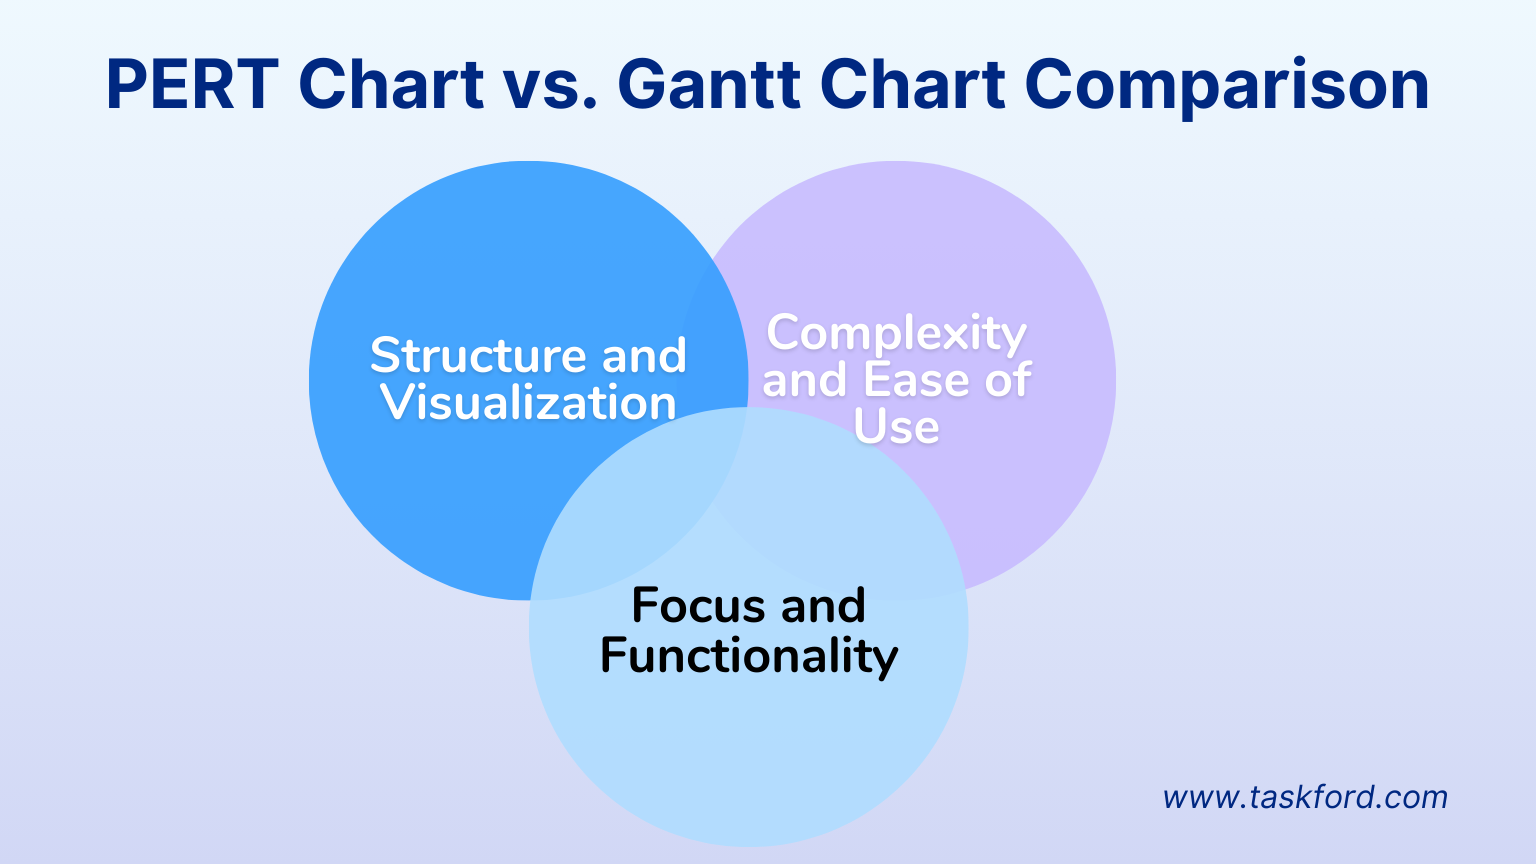
1. Structure and Visualization
In a PERT chart vs Gantt chart comparison, visualization is a major distinction. A PERT chart uses a network diagram, with nodes and arrows mapping task dependencies in a web-like layout. Meanwhile, a Gantt chart opts for a bar chart format, displaying tasks as horizontal bars along a timeline. Each approach shapes how you see your project at a glance.
2. Focus and Functionality
Functionally, these tools diverge sharply. A PERT chart zeroes in on time estimation and critical path analysis, helping you predict durations in uncertain projects. A Gantt chart, by contrast, focuses on scheduling and progress tracking, offering a clear view of deadlines and task completion over time.
3. Complexity and Ease of Use
PERT charts bring complexity to the table—ideal for detailed planning but harder to set up and maintain, especially for novices. Gantt charts, however, prioritize simplicity, making them quick to create and intuitive for teams of all sizes to use effectively.
Comparison Table: PERT Chart vs Gantt Chart
| Aspect | PERT Chart | Gantt Chart |
|---|---|---|
| Structure | Network diagram (nodes & arrows) | Bar chart (horizontal timeline) |
| Focus | Time estimation, critical path | Scheduling, progress tracking |
| Ease of Use | Complex, time-intensive | Simple, user-friendly |
| Best For | Uncertain, complex projects | Clear, deadline-driven projects |
When to Use PERT Chart vs Gantt Chart
Choosing between a PERT chart vs Gantt chart depends on your project’s needs - here’s how to pick the right one based on real-world scenarios.
Best Scenarios for a PERT Chart
A PERT chart shines in complex, uncertain projects where timing is unpredictable. Think new product development, where tasks like prototyping and testing have unclear durations, or research projects, where dependencies and variables shift constantly. Its focus on critical path analysis and time estimation makes it perfect for navigating ambiguity with precision.
Best Scenarios for a Gantt Chart
A Gantt chart excels in projects with defined timelines and clear milestones. Picture construction, where phases like foundation work and framing need tight scheduling, or marketing campaigns, where launches and deliverables follow a set plan. Its visual simplicity keeps teams on track. For more on mastering Gantt charts, see our Gantt Chart Definition and Complete Guide.
How TaskFord Supports Gantt Charts (and Beyond)
TaskFord supercharges Gantt charts, turning them into a powerhouse for project management—whether you’re weighing a PERT chart vs Gantt chart or jumping right into planning. Its standout strengths make scheduling smoother and more effective:
- Drag-and-Drop Scheduling: Easily tweak timelines as priorities change, no fuss required.
- Milestone Tracking: Highlight critical wins—like a product launch or phase end—to keep momentum high.
- Resource Allocation: Assign team members to tasks, ensuring balanced workloads.
- Dependency Mapping: Link tasks to visualize their flow, keeping projects on track.
- Intuitive Design: A clean, user-friendly interface that simplifies Gantt chart creation and updates.
Beyond Gantt charts, TaskFord adapts to any workflow, offering flexibility for all project types. Ready to streamline your planning? Try TaskFord today and experience the difference.
Conclusion: PERT Chart vs Gantt Chart - Making the Right Choice
In the PERT chart vs Gantt chart debate, your project goals determine the winner. PERT charts excel for time-focused complexity, think research, or innovation projects where uncertainty rules. Gantt charts, on the other hand, deliver visual simplicity, perfect for construction or marketing timelines that demand clarity. Both tools have their place, but the choice hinges on whether you need detailed time analysis or straightforward scheduling. Want to master Gantt charts? Dive into our Complete Guide. Curious about Gantt basics? Check out What is a Gantt Chart?

Making work simpler,
smarter, and more connected
Join our waitlist and be notified first.

Related Blog


Subscribe for Expert Tips
Unlock expert insights and stay ahead with TaskFord. Sign up now to receive valuable tips, strategies, and updates directly in your inbox.