What Is Earned Value Management (EVM) and How To Calculate It
Understand key Earned Value Management formulas like CV, SV, CPI, and SPI. Learn how to measure cost and schedule performance to keep projects on track.
Projects rarely fail overnight. Delays, overspending, and misaligned expectations often grow slowly and quietly until they become visible too late. Many organizations face this challenge because they rely on subjective updates rather than measurable performance data.
Earned Value Management (EVM) offers a structured solution. By combining scope, schedule, and cost, EVM allows project managers to assess progress accurately and forecast outcomes before problems escalate. This article explains what Earned Value Management is, how to calculate it, and how businesses have successfully applied it to keep projects under control.
Understanding Earned Value Management
Earned Value Management (EVM) is a technique that integrates three critical aspects of a project: scope, schedule, and cost. It provides an objective measure of performance by comparing what was planned with what has actually been achieved and how much it cost.
The core idea is simple: track planned progress versus actual progress, and use that comparison to determine whether the project is ahead, behind, or on track. This approach replaces assumptions and opinions with quantifiable data that supports better decisions.
Key benefits of EVM include:
- It provides quantitative performance tracking instead of relying on subjective opinions.
- It identifies potential problems early enough for corrective action.
- It helps managers forecast project outcomes with greater accuracy.
Example: Imagine a construction firm building a new office tower. The project is scheduled to complete 40% of the foundation work by month two, at a cost of $200,000. If, at the end of month two, only 25% of the foundation is done and $180,000 has already been spent, EVM reveals that progress is behind schedule while costs are close to the planned amount. This insight enables the project manager to make timely decisions before the project drifts further off course.
Key Components of Earned Value Management
Planned Value (PV)
Planned Value is the budgeted cost for the work scheduled up to a specific point in time. It represents how much work should have been completed according to the project plan. PV helps define the baseline against which performance is measured.
For instance, if a marketing campaign is budgeted at $100,000 over ten weeks, and by week five, the plan calls for half of the tasks to be done, the Planned Value at that point is $50,000.
Earned Value (EV)
Earned Value is the budgeted cost of the work actually completed. It shows the value of what has been achieved in terms of the original budget.
Continuing the same example, if the team has completed 40% of the planned tasks by week five, the Earned Value is $40,000. EV helps compare the actual progress with what was scheduled.
Actual Cost (AC)
Actual Cost is the total cost incurred for the work performed. It reflects the real amount spent, including materials, labor, and other expenses.
If the team has spent $45,000 by week five, the Actual Cost is $45,000. Comparing EV and AC shows whether the project is spending more or less than expected for the work completed.
Budget at Completion (BAC)
Budget at Completion is the total planned budget for the project. It represents the amount originally estimated to complete all project work. This figure becomes the foundation for long-term performance analysis.
Estimate at Completion (EAC)
Estimate at Completion is the forecasted total cost of the project based on current performance trends. It helps managers predict whether the project will finish under or over budget.
How to Calculate Earned Value Management Metrics
Cost Variance (CV)
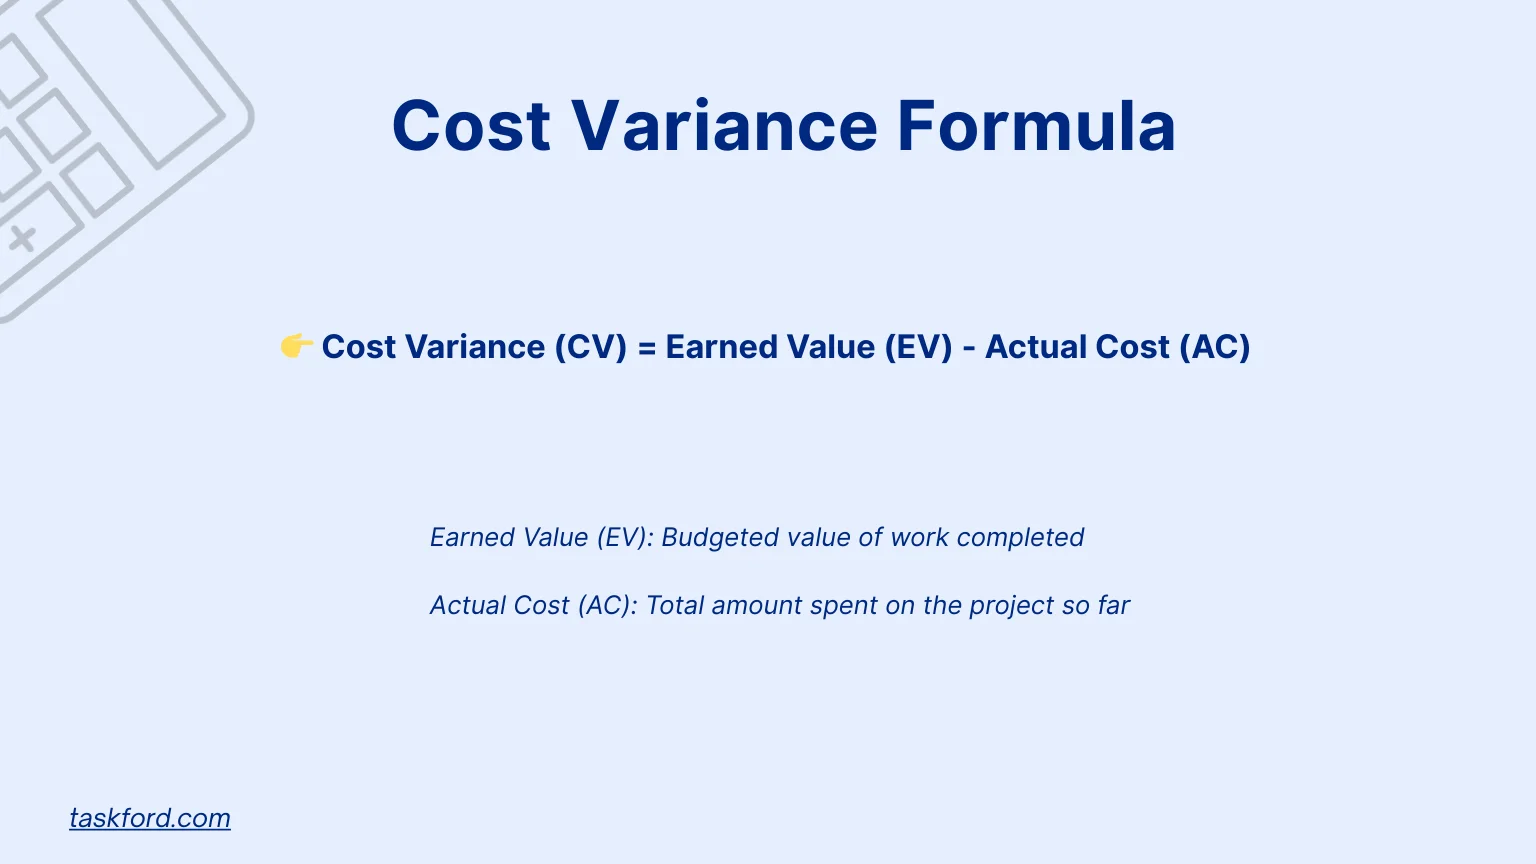
Formula: CV = EV − AC
Cost Variance indicates whether the project is under or over budget.
- CV > 0: The project is under budget.
- CV = 0: Spending is exactly on budget.
- CV < 0: The project is over budget.
Example: If a digital marketing project has an Earned Value (EV) of $40,000 and an Actual Cost (AC) of $45,000, then: CV = 40,000 − 45,000 = −5,000 This means the project is $5,000 over budget, signaling inefficiency in spending or resource use.
Schedule Variance (SV)
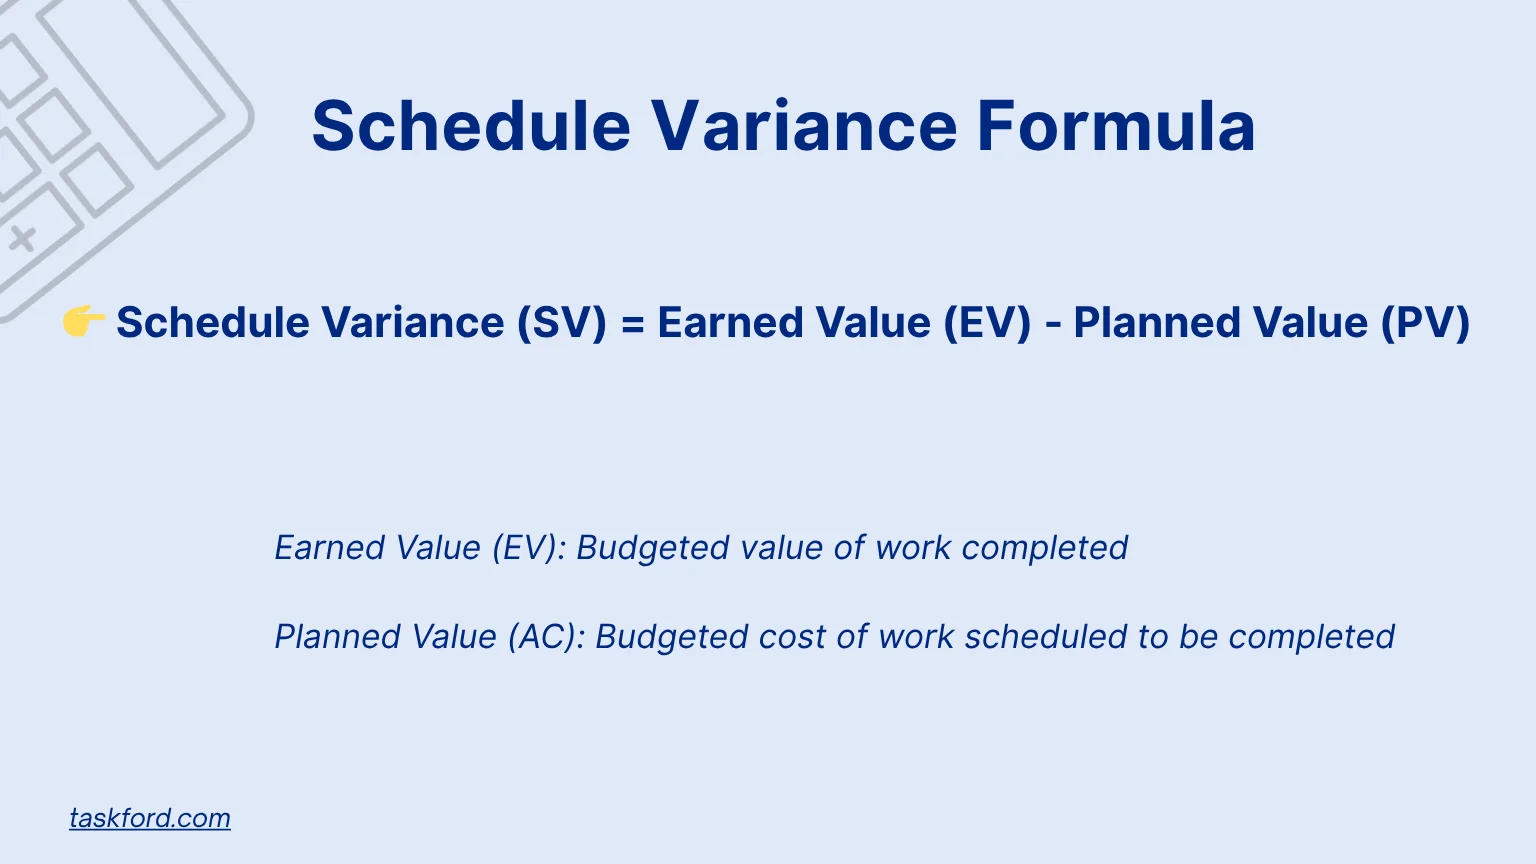
Formula: SV = EV − PV
Schedule Variance measures whether the project is ahead or behind schedule.
- SV > 0: Ahead of schedule.
- SV = 0: On schedule.
- SV < 0: Behind schedule.
Example: If the Earned Value (EV) is $40,000 and the Planned Value (PV) is $50,000, then: SV = 40,000 − 50,000 = −10,000 This means the project has completed $10,000 less work than planned, suggesting a delay.
Cost Performance Index (CPI)
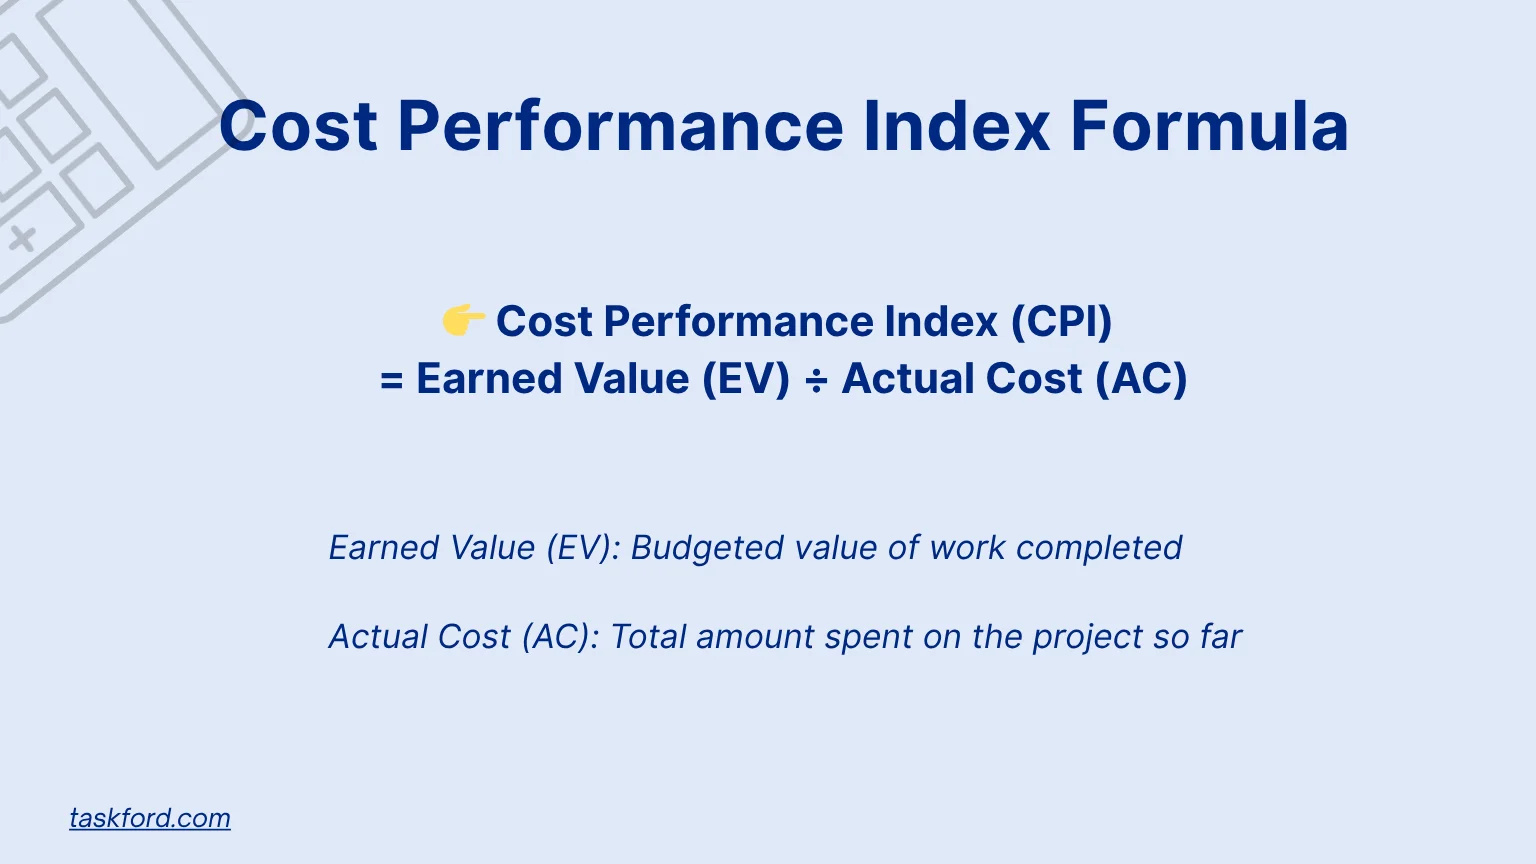
Formula: CPI = EV ÷ AC
CPI measures cost efficiency — how effectively the project is converting spending into progress.
- CPI > 1: Performing better than expected (under budget).
- CPI = 1: On budget.
- CPI < 1: Cost performance is poor (over budget).
Example: If EV = $40,000 and AC = $45,000, then: CPI = 40,000 ÷ 45,000 = 0.89 This means the project is achieving only $0.89 worth of work for every $1 spent, highlighting poor cost efficiency.
Schedule Performance Index (SPI)
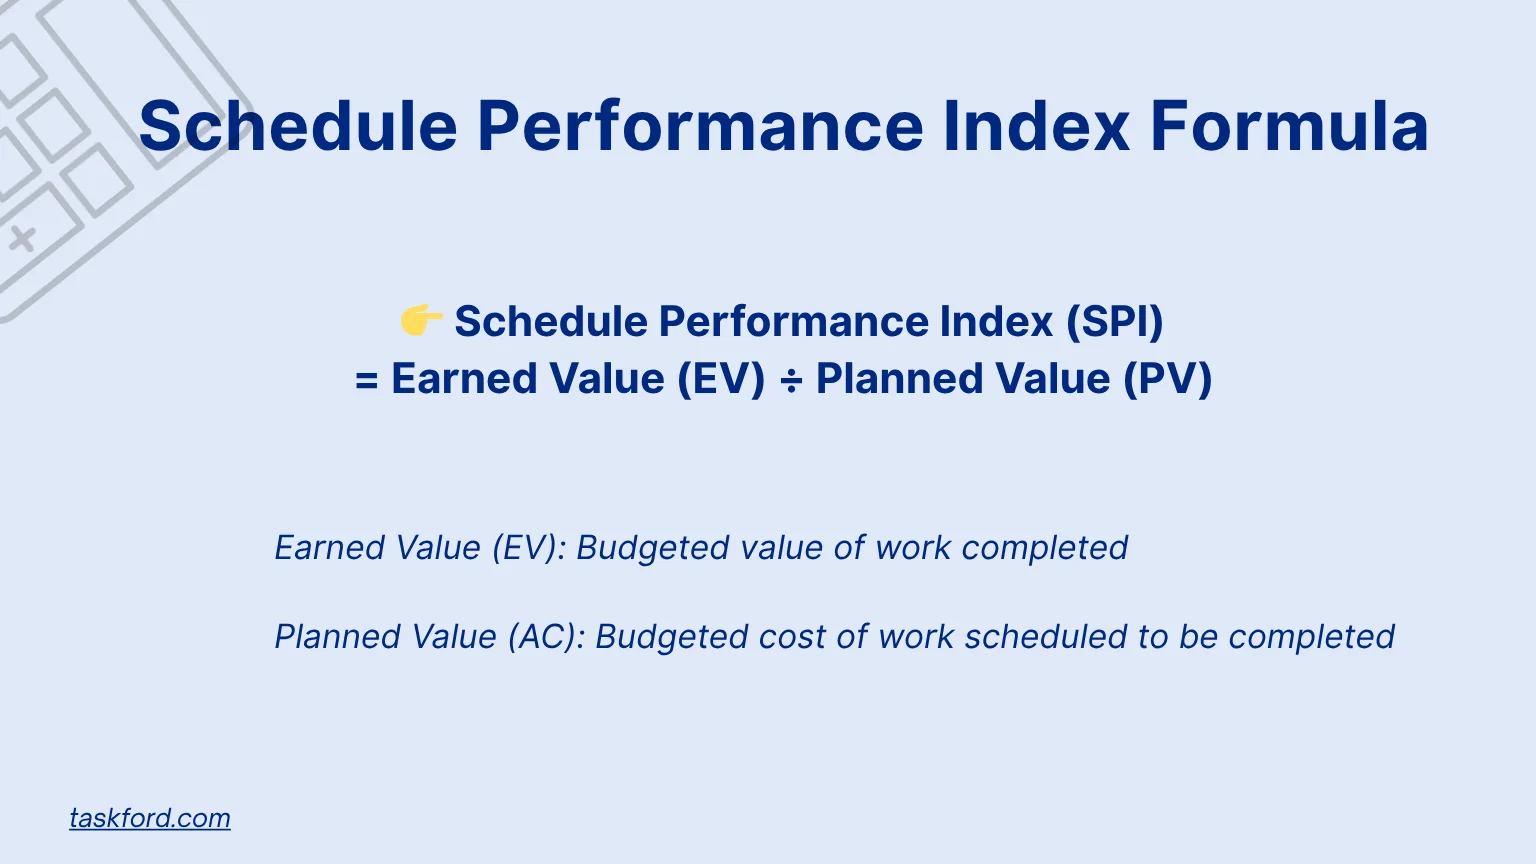
Formula: SPI = EV ÷ PV
SPI measures schedule efficiency - how efficiently the project is progressing compared to the plan.
- SPI > 1: Ahead of schedule.
- SPI = 1: On schedule.
- SPI < 1: Behind schedule.
Example: If EV = $40,000 and PV = $50,000, then: SPI = 40,000 ÷ 50,000 = 0.8 An SPI of 0.8 means the project is progressing at only 80% of the planned rate.
Estimate at Completion (EAC)
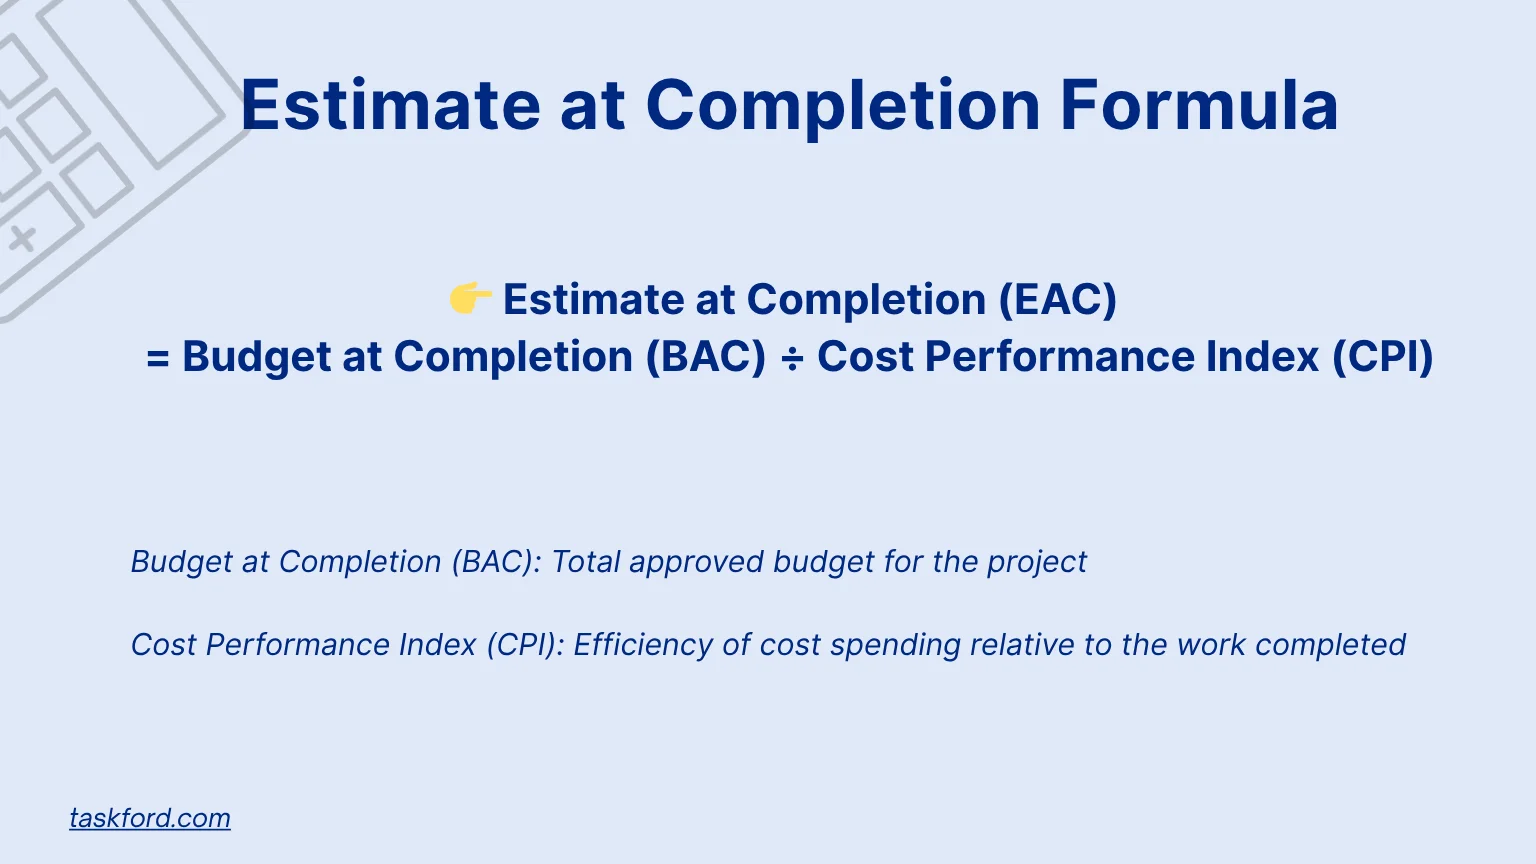
Formula: EAC = BAC ÷ CPI
EAC forecasts the total cost of the project based on current cost efficiency. It helps project managers anticipate the final cost before completion.
Example: If BAC = $200,000 and CPI = 0.89, then: EAC = 200,000 ÷ 0.89 = 224,719 This means the project is projected to cost approximately $224,719 by completion, indicating a potential overrun of $24,719.
How to Interpret EVM Metrics
Understanding EVM metrics is about more than just reading numbers. Each indicator tells a story about how the project is performing and where attention is needed for improved project management.
- A negative Cost Variance or a CPI below 1 means the project is spending more than planned for the work completed. Managers should investigate causes such as underestimated costs, inefficiency, or scope changes.
- A negative Schedule Variance or an SPI below 1 indicates delays. Managers should examine potential causes such as slow progress, resource shortages, or unmet dependencies, and take corrective action to bring the project back on track.
- When both CPI and SPI fall below 1, the project is both behind schedule and over budget. Managers should immediately review cost and schedule issues, identify the root causes, and implement corrective measures to prevent further overruns or delays.
- Positive variances indicate strong project performance in terms of cost, schedule, or both. Managers can use this insight to reallocate resources efficiently, refine schedules, or optimize project planning for continued success.
Earned Value Management Success in Real-Life Projects
IT Project Case: Software Deployment
A large software company implemented EVM during a major enterprise system upgrade. The project team tracked PV, EV, and AC on a biweekly basis. Halfway through the timeline, EVM revealed an SPI of 0.85 and a CPI of 0.92.
Although the project still appeared manageable through standard reports, these EVM metrics signaled underlying inefficiencies. The team adjusted workloads, shifted tasks between developers, and prioritized key modules. By project close, CPI improved to 1.01, and the project finished within 2 percent of the original budget. Without EVM, the issues might have gone unnoticed until much later.
Marketing Project Case: Global Campaign Launch
A global marketing agency applied EVM to manage a product launch across multiple regions. Early tracking showed EV significantly lower than PV, while AC was climbing faster than planned. This meant the campaign was both behind schedule and over budget.
Using this data, the project manager postponed lower-impact deliverables and reallocated creative resources to focus on core assets. Within three weeks, SPI recovered from 0.78 to 0.96, and CPI rose to 1.02. The campaign ultimately launched on time, demonstrating how EVM can guide strategic trade-offs to protect the bigger picture.
Implementing Earned Value Management
Implementing EVM is most effective when approached in a few structured steps:
Step 1: Establish the Project Baseline
Define the total scope, timeline, and approved budget. This project baseline sets the Planned Value against which progress will be measured.
Step 2: Assign Value to Work Packages
Break down the project into measurable tasks or deliverables. Assign each a budgeted value so that progress can be tracked in financial terms.
Step 3: Track Actual Costs and Progress
Record costs as they occur and update task completion percentages regularly. This data provides the Actual Cost and Earned Value inputs.
Step 4: Calculate Key EVM Metrics
Use the formulas for CV, SV, CPI, and SPI to measure performance. Identify where the project is off track.
Step 5: Take Corrective Action
If results show underperformance, review causes and adjust plans, budgets, or resource allocation. Regular reviews turn EVM into a proactive control tool rather than a reporting exercise.
Limitations and Considerations
While Earned Value Management provides valuable insights, there are important limitations to keep in mind:
- Dependence on Accurate Data: EVM metrics are only as reliable as the data entered. Incomplete or outdated progress or cost reporting can distort results.
- Complexity in Setup: Implementing EVM requires establishing a detailed baseline, assigning values to tasks, and consistently tracking progress, which can be time-consuming.
- Limited Insight into Root Causes: EVM shows what is happening but not why. Variances require additional analysis to understand underlying problems.
- Suitability to Project Type: EVM works best for projects with clearly defined scope and project deliverables. Agile or creative projects may find it harder to quantify progress.
- Organizational Readiness: Teams need standardized cost tracking, schedule control, and a culture of transparent reporting. Without this, EVM results may be technically correct but practically misleading.
- Interpretation Requires Context: Metrics like CPI and SPI indicate trends but do not automatically reflect success or failure. Project context and qualitative factors are essential for informed decisions.
With these limitations, it’s recommended that EVM Metrics should also be combined with other methods such as Time-Series forecasting for a more thorough analysis and prediction.
Conclusion
Earned Value Management is a structured way to measure how a project is performing in terms of cost, schedule, and scope. By combining these three dimensions into a single system, it provides early insight into trends that can affect success.
While it requires reliable data and disciplined tracking, the value it provides is significant. Projects that adopt EVM gain greater control, stronger visibility, and the ability to make decisions based on evidence rather than guesswork.
Learn more
- What is Project Management? A Beginner’s Comprehensive Guide 2026
- What Does A Project Manager Do? A Guide to Advancing Your Career
- 80 Key Project Management Terms You Should Know
Subscribe for Expert Tips
Unlock expert insights and stay ahead with TaskFord. Sign up now to receive valuable tips, strategies, and updates directly in your inbox.