What Are the 4 Types of Gantt Chart Dependencies?
Discover the 4 types of Gantt Chart Dependencies with examples and learn how to show it on the Gantt Chart.
In previous articles, we introduced the fundamental concepts and components of a Gantt chart. Among these, we discussed task dependencies, a crucial element that defines the relationships between tasks. Gantt chart dependencies play a significant role in managing these relationships effectively by visualizing them on a timeline. This makes it easier for project managers and stakeholders to determine the start and end times of tasks.
In this article, we will dive deeper into the four most common types of dependencies in Gantt charts: Start-to-Start (SS), Finish-to-Finish (FF), Start-to-Finish (SF), and Finish-to-Start (FS). We will explore the differences between each type and how to apply them effectively for optimal project management. Understanding task dependencies is essential for improving workflow, preventing delays, and ensuring that tasks are completed in the right order.
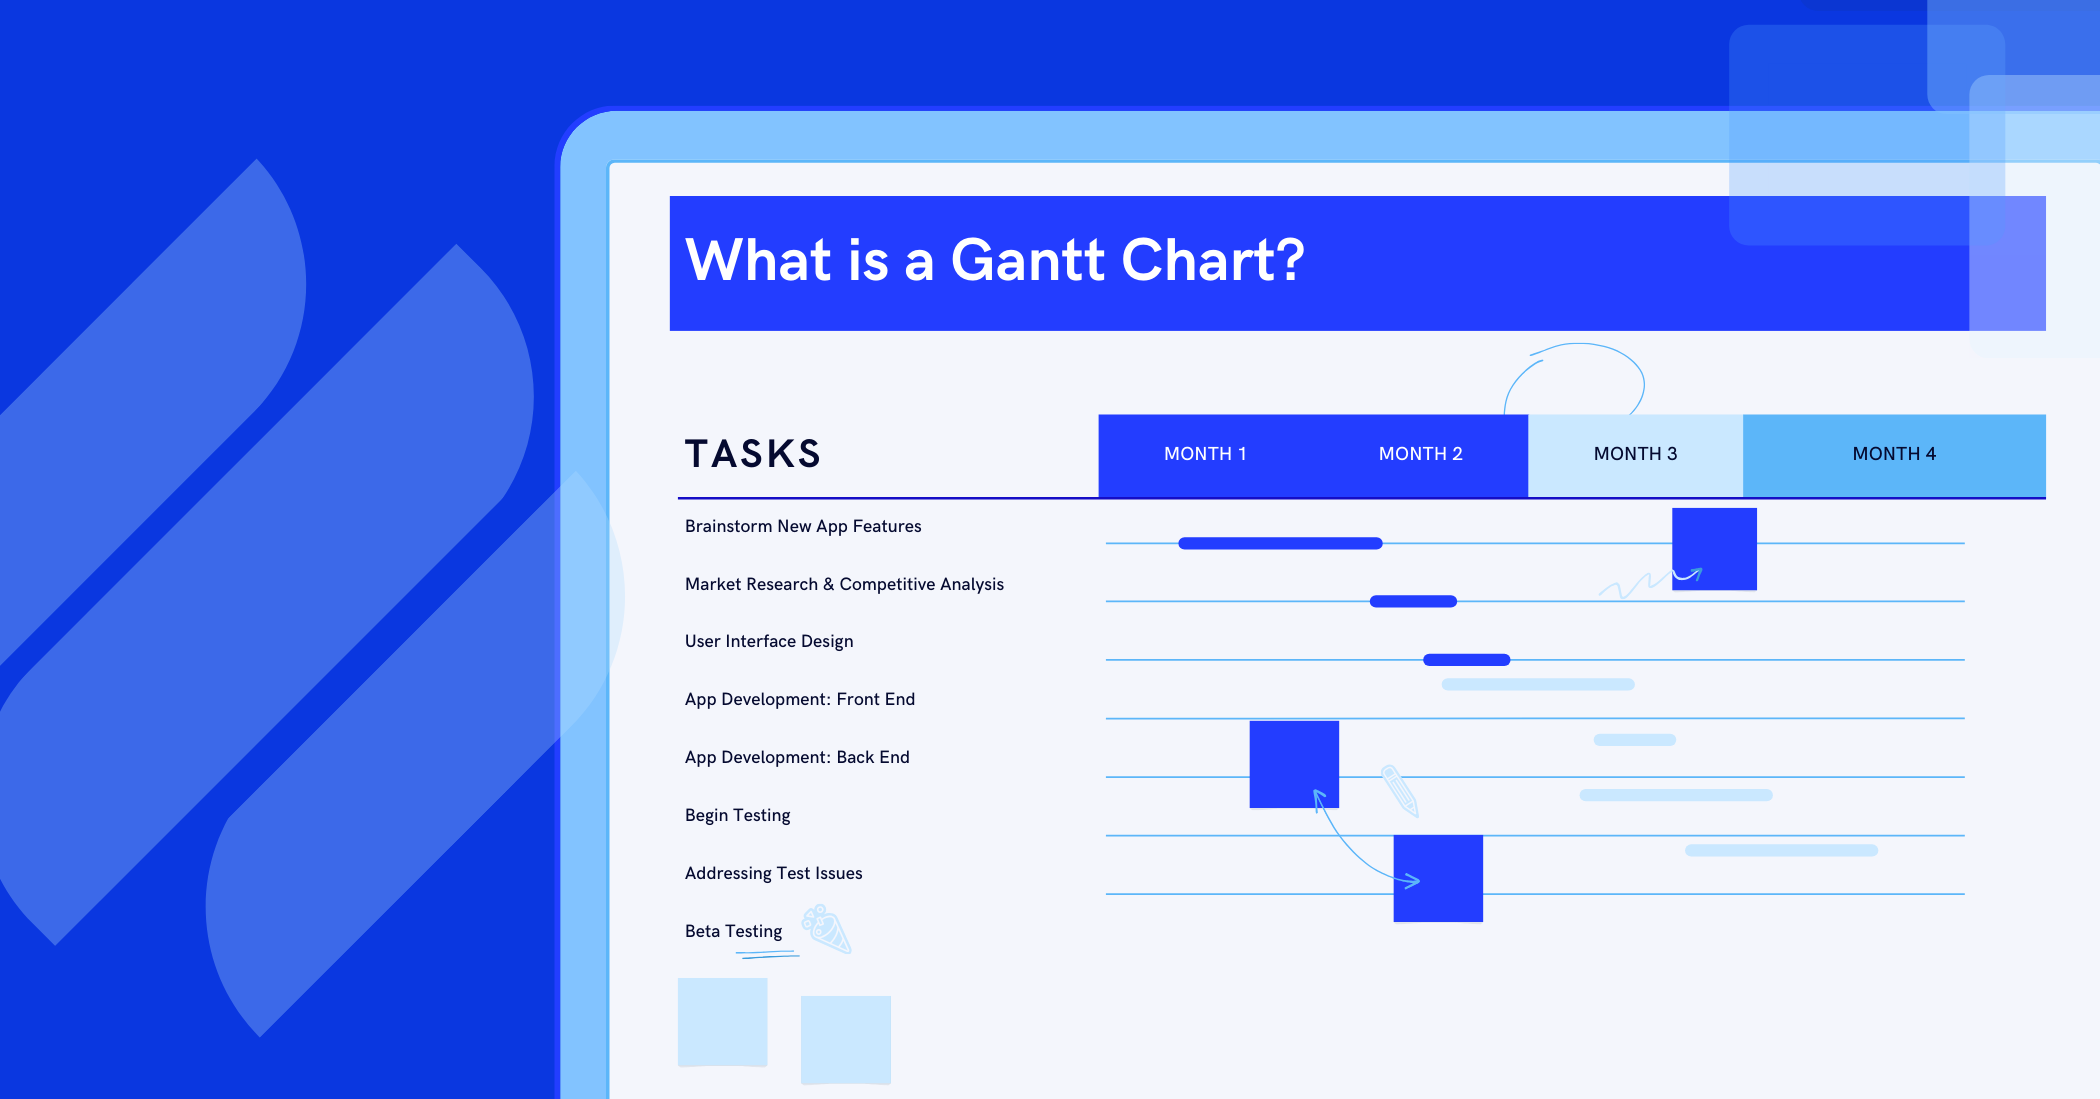
What Are Dependencies in a Gantt Chart?
In project management, projects are often broken down into smaller tasks. These tasks are frequently interrelated, meaning some tasks cannot begin until others are completed. The term task dependencies refers to these relationships, which define how the start or finish of one task impacts others, and ultimately, how these dependencies affect the entire project.
In a Gantt chart, these dependencies are visually represented by arrows linking the Gantt bars that represent each task. These arrows indicate when a task can begin or must be completed based on the status of other tasks. This visual representation enables project managers to quickly view the entire project timeline, identify critical tasks, and make adjustments to the schedule as necessary, ensuring smooth project execution.
Why Understanding Gantt Chart Dependencies Matters
As mentioned earlier, a Gantt chart is an essential tool for visualizing projects and tasks along a timeline. However, in large projects with hundreds or thousands of tasks, it can be difficult for project managers and team members to identify which tasks should take priority. This challenge arises because tasks do not always follow a simple linear flow, where one task ends and the next starts. Some tasks may be performed simultaneously, while others may need to wait for the completion of previous tasks before they can begin. Additionally, with many resources involved, improper prioritization and task sequencing can lead to resource conflicts or idle time.
Understanding Gantt chart dependencies is crucial for successful project management, as it provides a clear, visual representation of how tasks are interconnected. Below are some key reasons why understanding these dependencies is so important:
- Accurate Project Scheduling: By seeing how tasks depend on each other, project managers can create more precise project timelines. This helps anticipate potential delays and adjust schedules proactively, ensuring that tasks are completed on time.
- Optimized Resource Allocation: Understanding which tasks must be completed before others can start enables project managers to allocate resources more effectively. This ensures that teams are neither overburdened nor idle, maximizing productivity.
- Risk Management: Identifying potential bottlenecks and critical points in a project early allows project managers to take preventive measures. This helps minimize risks and avoid disruptions, ensuring the project stays on track.
- Improved Collaboration and Communication: When task dependencies are clearly defined, team members and stakeholders can better understand their roles and contributions. This clarity fosters better collaboration and communication across the project team, enhancing overall efficiency.
- Enhanced Project Tracking and Adjustments: Gantt chart dependencies provide a visual overview of the entire project, making it easier to track progress and make adjustments as necessary. Managers can quickly identify tasks that are falling behind or need attention, ensuring timely interventions and keeping the project on course.
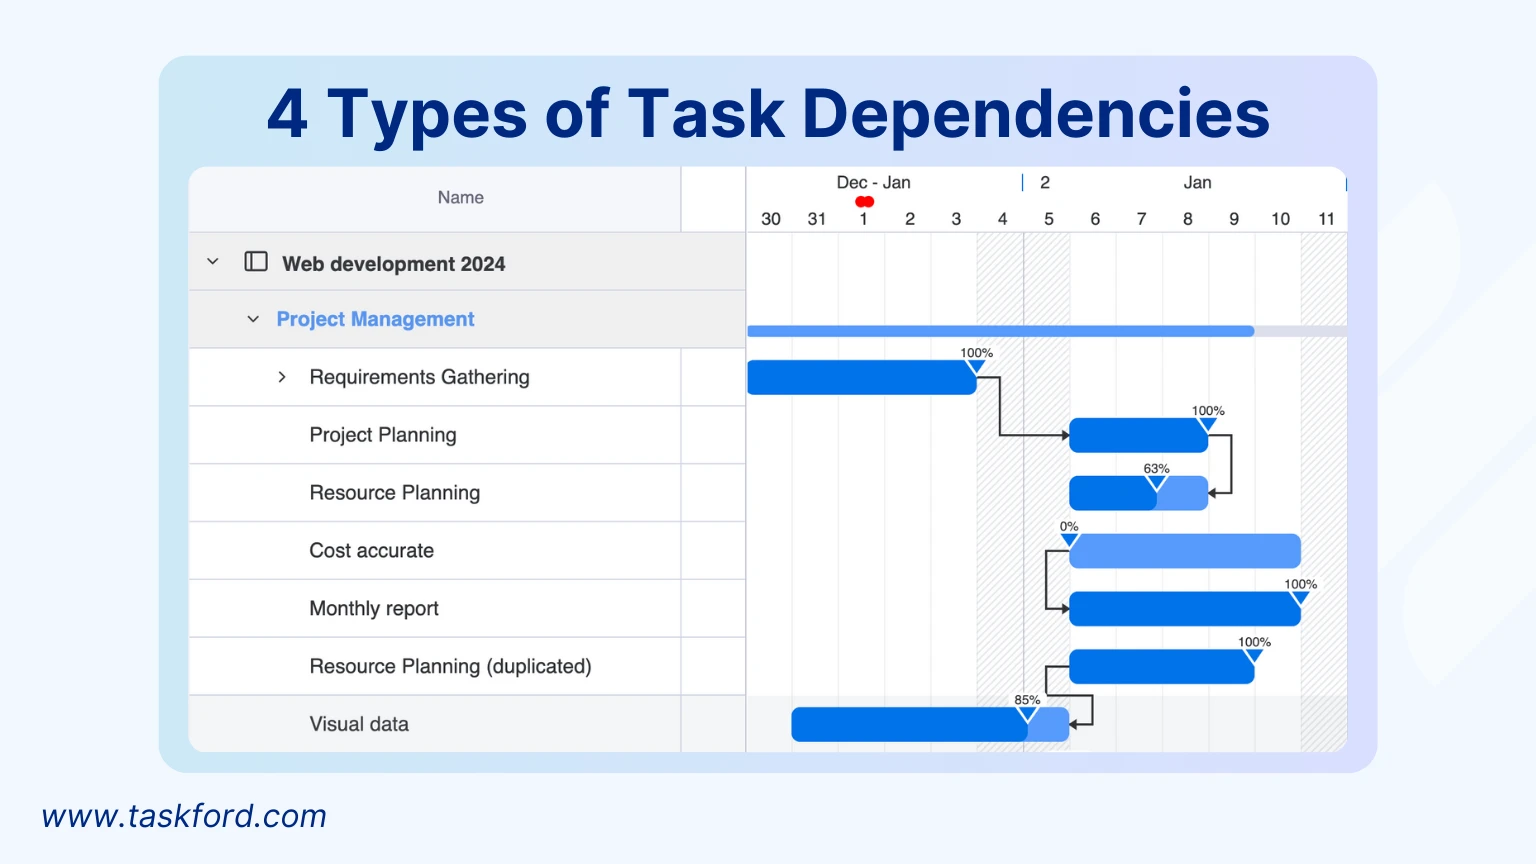
4 Types of Task Dependencies in Gantt Chart with Examples
In project management, understanding the four types of Gantt Chart Dependencies is essential for accurate task scheduling and efficient workflow management. Each dependency type determines how tasks are connected and the sequence in which they must be executed. Below, we explore each type with practical examples to help you manage your projects more effectively.
1. Finish-to-Start
A Finish-to-Start dependency is the most common type in project management. It means that one task must be completed before the next one can begin.
Example: If you're developing a website, you must complete the design phase before starting the coding phase. In your Gantt Chart, Task A (design) finishes, and only then can Task B (coding) start.
This dependency helps maintain a logical project flow, ensuring that no task starts prematurely and every prerequisite is met.
2. Start-to-Start
In a Start-to-Start dependency, two tasks begin at the same time, even though they might finish at different times.
Example: In a product launch project, creating marketing materials and preparing the sales team can start simultaneously. Task A (marketing content creation) and Task B (sales training) both start together, even though one might finish earlier than the other.
This type of Gantt Chart Dependency is useful when tasks need to run in parallel, optimizing project timelines and resource allocation.
3. Finish-to-Finish
A Finish-to-Finish dependency requires that two tasks finish at the same time, though they may start at different times.
Example: In event management, setting up the venue and preparing the catering must both be completed before the event begins. Task A (venue setup) and Task B (catering) need to finish simultaneously to ensure a smooth event.
Using this dependency in your Gantt Chart ensures that related tasks are completed together, maintaining the project’s overall schedule.
4. Start-to-Finish
A Start-to-Finish dependency is the least common type. It means that a task cannot be finished until another task has started.
Example: In a shift-based work environment, the outgoing shift cannot finish until the incoming shift has started. Task A (new shift start) triggers the end of Task B (current shift).
Though rare, this type of task dependency is crucial for projects with sequential handovers and continuous operations.
How to show dependencies in a Gantt chart
In project management, “dependencies” refer to the relationships between tasks, meaning one task relies on another to start or finish. On a Gantt chart, dependencies are not only defined but also visualized through connecting lines or arrows between task bars. This makes it easier for project managers to track the sequence of activities and ensure the schedule is clear. Below are some common ways to represent dependencies on a Gantt chart.
1. Using Arrows (Task Linking)
![]()
In most Gantt chart tools, task dependencies are represented by arrows connecting task bars. The arrow points from the predecessor task to the successor task. For example, if Task A must be completed before Task B can begin (Finish-to-Start relationship), an arrow will connect the end of Task A’s bar to the start of Task B’s bar.
Software such as TaskFord, Microsoft Project, and Asana allows users to create these links easily by dragging and dropping from the start or end of one task bar to another.
When creating links, you need to specify the type of dependency:
- FS (Finish-to-Start): arrow from the end of Task A → start of Task B
- SS (Start-to-Start): arrow from the start of Task A → start of Task B
- FF (Finish-to-Finish): arrow from the end of Task A → end of Task B
- SF (Start-to-Finish): arrow from the start of Task A → end of Task B
Once the link is established, the Gantt chart automatically updates to visually reflect the dependency between tasks.
2. Adding Lag and Lead Time

In some cases, tasks do not start or finish immediately after their predecessor. Instead, there may be a delay (lag) or an overlap (lead) between them.
- Lag: The waiting period between two tasks. Example: If Task B starts 3 days after Task A finishes, Task B’s bar will appear to begin 3 days later.
- Lead: When a task starts earlier than its dependency would normally allow. Example: Task B can begin 2 days before Task A is finished.
Most tools let you set this directly in the dependency by adding time values, such as “+3d” for a 3-day lag or “-2d” for a 2-day lead.
For more details on Lag and Lead time, check out the blog: Lead and Lag Time in Project Management: Key Concepts and Calculation Methods
3. Task Numbering or IDs

In addition to arrows on the Gantt chart, some project management tools let you define dependencies using task IDs. Each task in the project has a unique ID (for example, Task 5, Task 7). To create a dependency, you simply enter the predecessor’s ID along with the type of relationship.
For example: If you enter “5FS+2d” for Task 7, it means:
- Task 7 depends on Task 5.
- The dependency type is Finish-to-Start (FS) → Task 7 can only begin once Task 5 is finished.
- There is a +2 day lag, so Task 7 starts two days after Task 5 ends.
These ID-based dependencies are usually shown in the table view beside the Gantt chart, making it easier for project managers to track dependencies both numerically and visually.
Conclusion
Understanding and managing Gantt Chart Dependencies is key to keeping your projects on track. By using the right dependency types: Finish-to-Start, Start-to-Start, Finish-to-Finish, and Start-to-Finish, you can ensure seamless task flow and efficient scheduling. Tools like TaskFord simplify this process with features like auto-scheduling and lead/lag time adjustments.

Making work simpler,
smarter, and more connected
Join our waitlist and be notified first.

Related Blog


Subscribe for Expert Tips
Unlock expert insights and stay ahead with TaskFord. Sign up now to receive valuable tips, strategies, and updates directly in your inbox.