What Are Burndown Charts and Why Your Projects Need Them
Discover how burndown charts improve project management by visualizing progress, tracking team performance, and optimizing task management efficiency.
Burndown charts are a cornerstone of effective project management, providing teams with a clear, visual way to track progress and manage tasks in Agile environments. These charts offer a data-driven approach to monitoring work completion, identifying bottlenecks, and ensuring projects stay on schedule. By incorporating burndown charts into your project management toolkit, you can enhance transparency, improve forecasting, and keep your team aligned toward shared goals.
This guide explores what burndown charts are, how they work, their benefits, limitations, and practical strategies for leveraging them to optimize task management and achieve project success.
What Is a Burndown Chart?
A burndown chart is a graphical tool that illustrates the amount of work remaining in a project or sprint against the time available to complete it. Rooted in Agile Methodologies, particularly Scrum, it plots remaining tasks or story points on the vertical axis (y-axis) and time on the horizontal axis (x-axis). The chart’s name comes from the idea of “burning down” the remaining work as tasks are completed, ideally trending toward zero by the project’s end.
Unlike traditional project management tools like Gantt charts, which focus on task dependencies and milestones, burndown charts emphasize the pace of task completion. They provide a real-time snapshot of whether a team is on track to meet deadlines, making them invaluable for Agile teams managing iterative sprints or complex projects. By visualizing progress, burndown charts help teams stay aligned and proactive in addressing challenges.
Key Components of a Burndown Chart
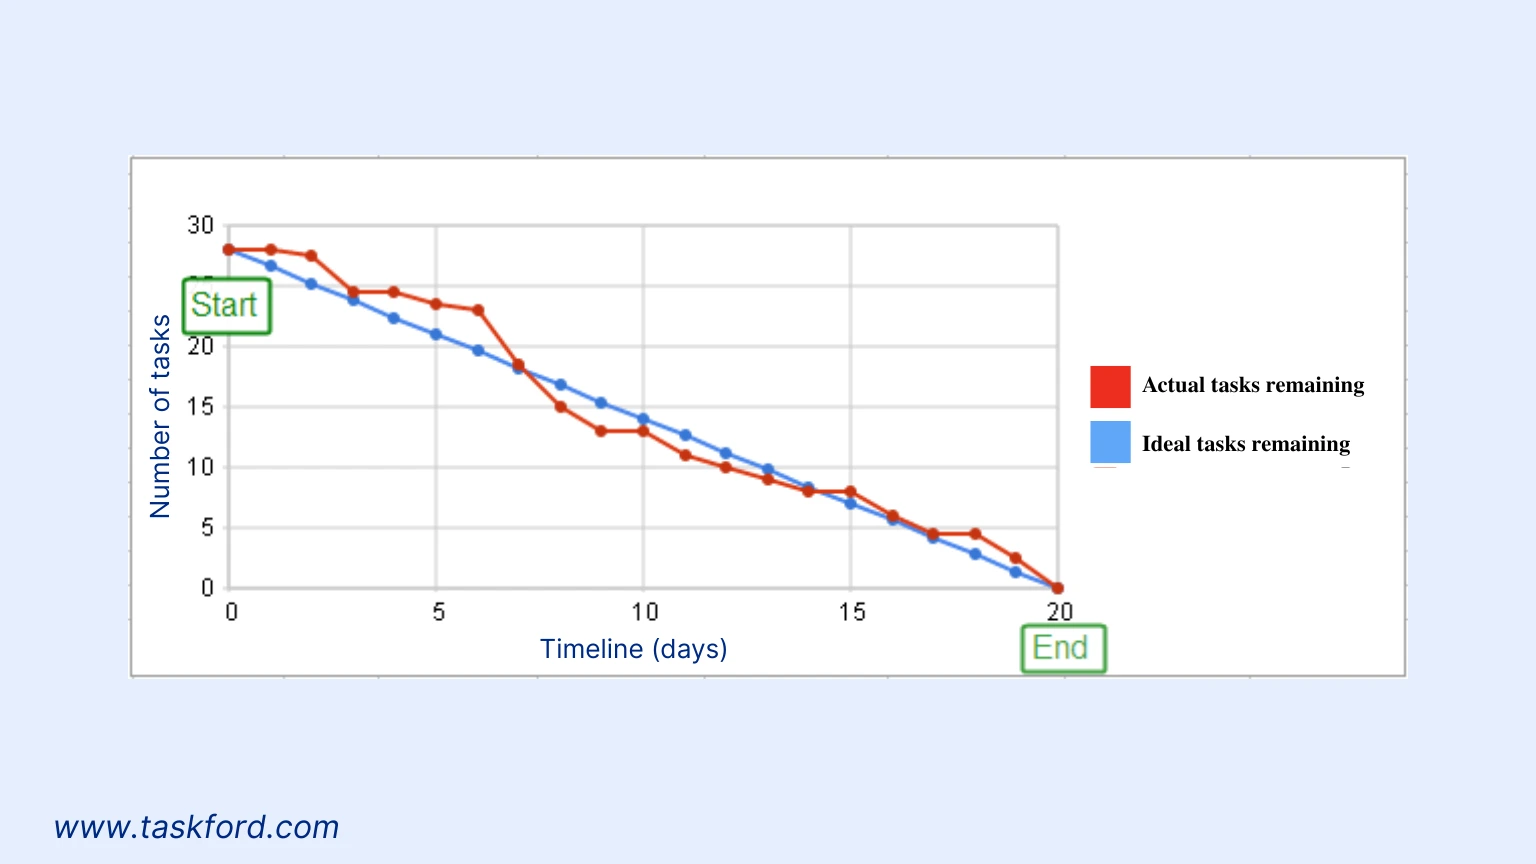
To understand how burndown charts function, let’s break down their core elements:
- X-Axis (Time): The horizontal axis represents the duration of the project or sprint, typically measured in days, weeks, or sprints. It starts at day zero (project kickoff) and extends to the deadline.
- Y-Axis (Work Remaining): The vertical axis quantifies the remaining work, often measured in story points, tasks, or estimated hours. Story points reflect the complexity and effort required for tasks, offering a flexible metric for progress tracking.
- Ideal Work Remaining Line: This straight, downward-sloping line represents the expected rate of task completion under ideal conditions. It serves as a benchmark for comparing actual progress.
- Actual Work Remaining Line: This line tracks the team’s real-time progress, updated daily or per sprint. It fluctuates based on the team’s actual pace, revealing deviations from the ideal plan.
These components work together to provide a clear picture of project health, making burndown charts a powerful tool for task management and progress monitoring.
Types of Burndown Charts
Burndown charts are versatile and can be adapted to various project management needs. Here are the primary types and their applications:
- Sprint Burndown Chart: Tracks progress within a single sprint, typically lasting 1–4 weeks. It’s ideal for teams working on short, iterative cycles, helping them monitor daily task completion and adjust priorities to meet sprint goals.
- Release Burndown Chart: Focuses on a product release spanning multiple sprints, tracking progress toward delivering a set of features or requirements. This chart provides a high-level view of progress across sprints.
- Product Burndown Chart: Also called an epic burndown chart, this type tracks the overall progress of a product or large body of work. It’s useful for long-term projects, offering a strategic perspective on task completion.
- Budget Burndown Chart: Tracks financial expenditure against time, ensuring projects stay within budget. This type is particularly valuable for cost-conscious project management. Integrate with earned value management (EVM) practices to ensure financial control.
Each type serves a specific purpose, allowing teams to tailor their use of burndown charts to the scope and complexity of their projects.
Why Use Burndown Charts in Project Management?
Burndown charts offer numerous benefits for project management, making them a go-to tool for Agile teams. Here’s why they’re essential:
Real-Time Progress Visualization
Burndown charts provide a clear, visual representation of task completion, enabling teams to see how much work remains at any given moment. By updating task statuses regularly, teams can track progress in real time, fostering transparency and accountability. For example, a team working on a two-week sprint to develop a new website feature can use a burndown chart to ensure they’re on pace to meet the deadline.
Early Identification of Bottlenecks
One of the greatest strengths of burndown charts is their ability to highlight discrepancies between the ideal and actual work lines. If the actual line trends above the ideal line, it signals that the team is falling behind schedule. This early warning allows project managers to identify bottlenecks such as resource constraints or underestimated tasks, and take corrective action like reallocating team members or reprioritizing tasks.
Enhanced Team Collaboration
Burndown charts serve as a shared reference point, fostering communication and alignment among team members. During daily stand-up meetings, teams can review the chart, discuss challenges, and collaborate on solutions to stay on track. This transparency boosts morale and keeps everyone focused on collective goals.
Improved Forecasting and Planning
By analyzing historical burndown charts, teams can refine their estimation processes. For instance, if a team consistently underestimates task complexity, the actual work line will lag behind the ideal line. Calculating team velocity, which is the rate at which tasks are completed, enables more accurate burndown charts for future sprints, improving planning precision.
Managing Scope Creep
Scope creep, where additional tasks are added mid-project, can derail timelines. Burndown charts make scope creep visible as spikes in the actual work line. By documenting and tracking new tasks, teams can discuss scope changes with stakeholders and adjust plans to maintain project alignment.
Limitations of Burndown Charts
Despite their advantages, burndown charts have limitations that teams should consider:
- Dependence on Accurate Estimates: Burndown charts rely on precise task estimations. Inaccurate story points or time estimates can misrepresent progress. Teams can mitigate this by refining estimates based on historical data after each sprint.
- Lack of Task Prioritization Insight: Burndown charts show the quantity of work completed but don’t differentiate between high and low priority tasks. Combining them with prioritization tools ensures critical tasks are addressed first.
- Limited Scope Adjustment: Unlike burnup charts, which track completed work and accommodate scope changes, burndown charts focus on remaining work within a fixed scope. Teams can use both chart types for a more comprehensive view.
- No Quality Metrics: Burndown charts measure task completion but not the quality of work. Integrating quality assurance processes ensures completed tasks meet standards.
How to Create a Burndown Chart
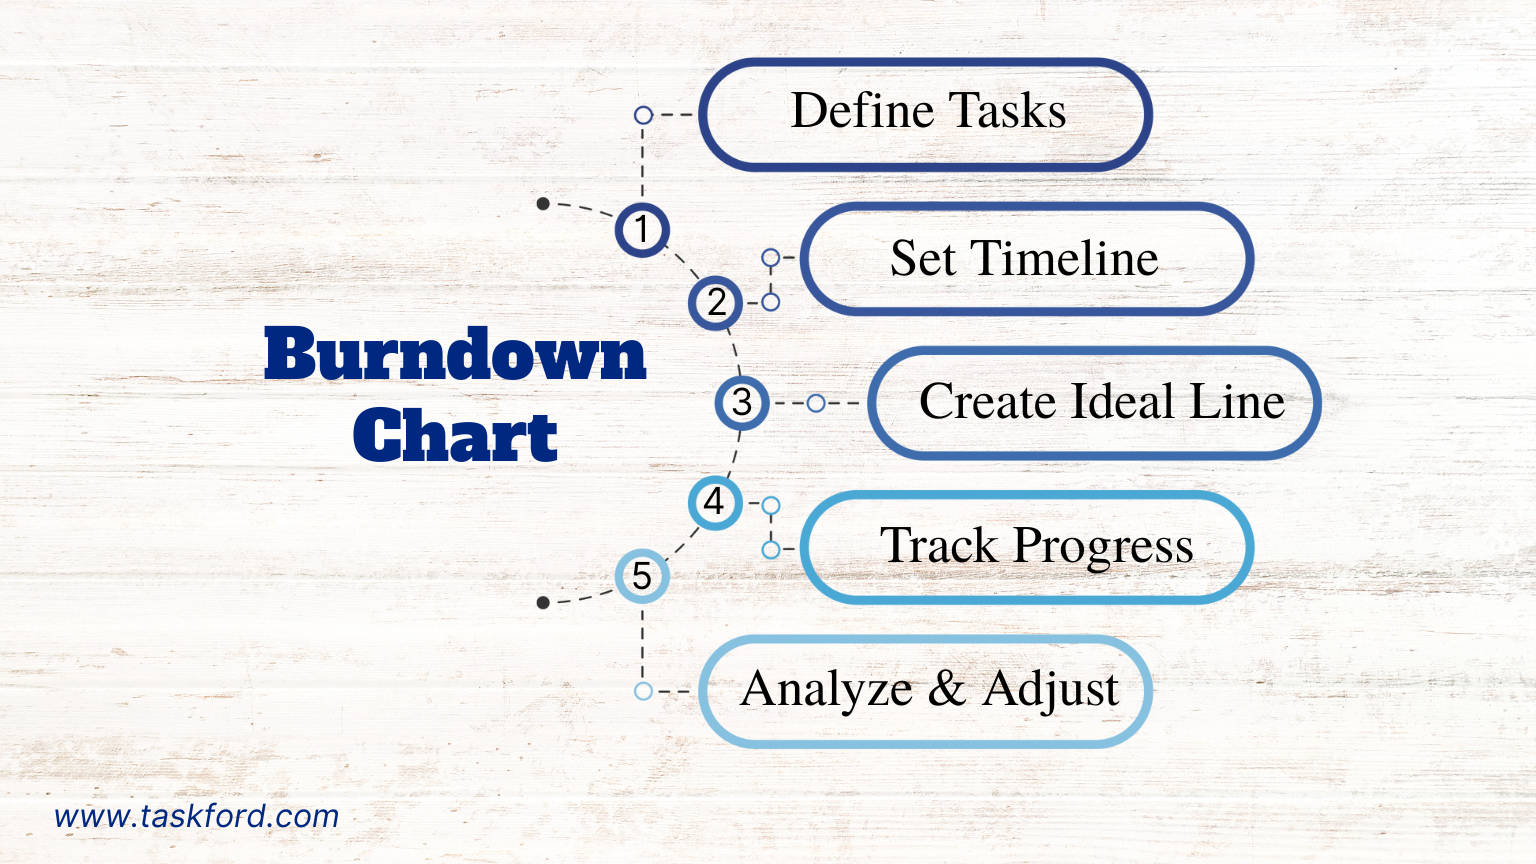
Creating a burndown chart is straightforward with the right tools. Here’s a step-by-step guide:
- Define Tasks: List all tasks or user stories for the sprint or project. Assign story points or estimated hours based on complexity and effort.
- Set the Timeline: Determine the duration of the sprint or project (e.g., 10 days or 4 weeks).
- Establish the Ideal Line: Using historical data or team velocity, plot a straight line from the total work to zero by the deadline.
- Track Progress Daily: Update task statuses daily to plot the actual work remaining line.
- Analyze and Adjust: Review the chart during stand-ups or sprint reviews. If the actual line deviates from the ideal line, address issues by reallocating resources or reprioritizing tasks.
Most project management software automates this process, generating real-time burndown charts based on task updates.
Burndown Chart vs. Burnup Chart: What’s the Difference?
While burndown charts focus on remaining work, burnup charts track completed work, rising from zero as tasks are finished. Both are valuable in Agile project management:
- Burndown Charts: These charts plot how much work is left as tasks are finished. The line moves downward toward zero, making it easy to see if the team is on pace to meet a fixed deadline. They’re best for short sprints where scope stays consistent.
- Burnup Charts: Burnup charts show how much work has been completed, rising upward as progress is made. They often include a total work line, helping teams visualize scope changes like new features added mid-sprint and their impact on delivery.
Teams can use both charts to gain a comprehensive view of project progress, switching based on project needs.
Best Practices for Using Burndown Charts
To maximize the value of burndown charts, follow these best practices:
- Update Regularly: Ensure task statuses are updated daily to keep the chart accurate.
- Refine Estimates: Use historical data to improve story point estimates for future sprints.
- Combine with Other Tools: Pair burndown charts with Kanban boards or prioritization tools to manage tasks effectively.
- Communicate with Stakeholders: Share charts during sprint reviews or client meetings to set clear expectations.
- Address Deviations Promptly: Act quickly if the actual work line trends above the ideal line, adjusting resources or priorities as needed.
Real-World Example: Burndown Charts in Action
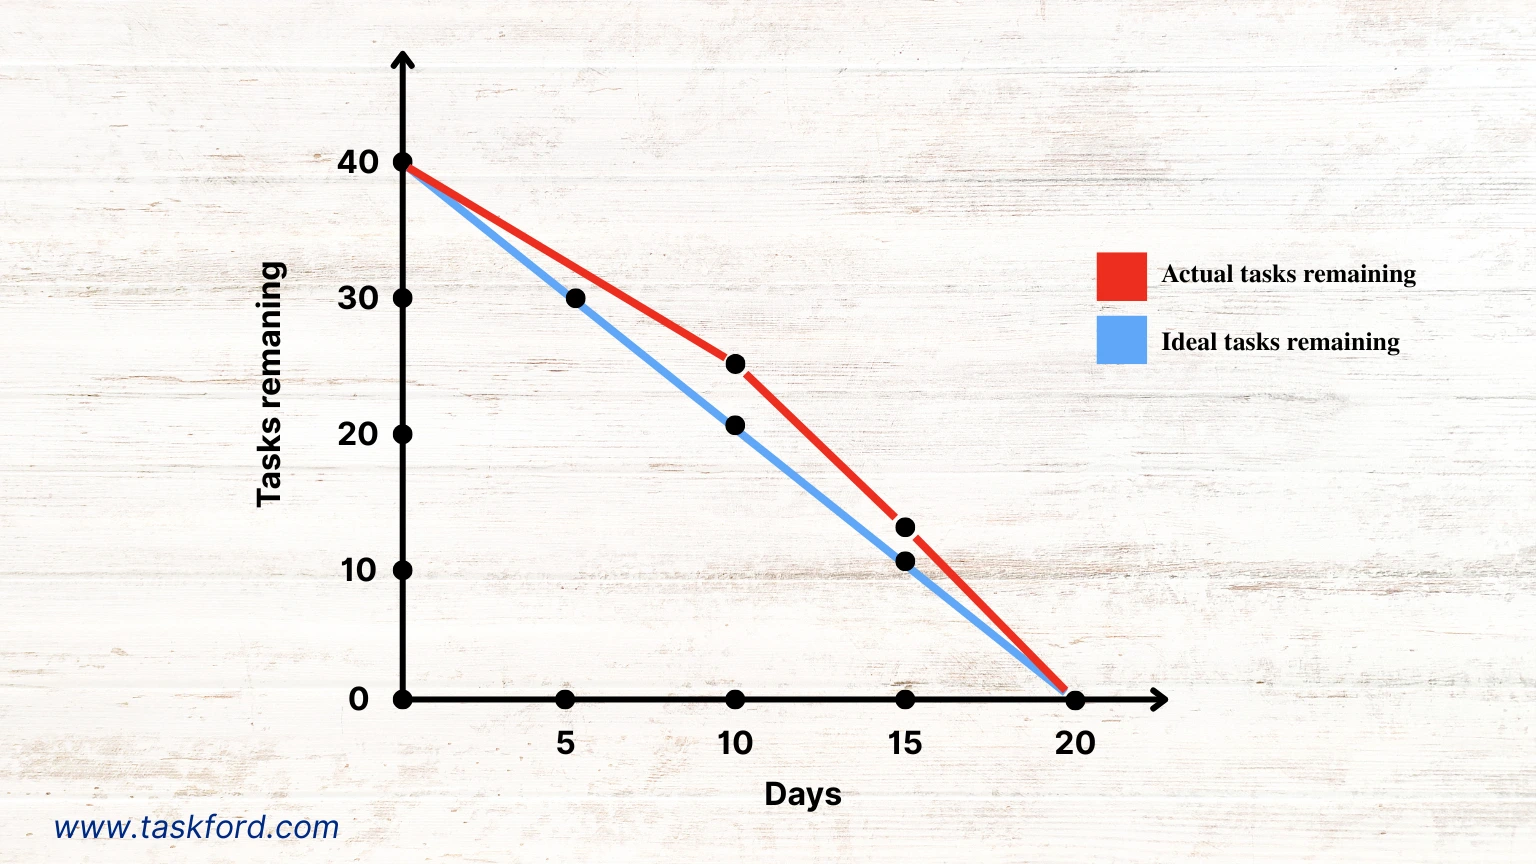
Imagine a team developing an e-commerce website over a four-week sprint with 40 story points of work, including tasks like designing the homepage, integrating payment gateways, and testing user flows. They create a sprint burndown chart with:
- X-Axis: 20 working days.
- Y-Axis: 40 story points.
- Ideal Line: A straight line from 40 story points on day 1 to 0 on day 20.
By day 10, the team has completed 15 story points, but the actual work line is above the ideal line, indicating slower progress. Analytics reveal that testing tasks are taking longer than estimated. The team reallocates resources to testing and adjusts priorities, bringing the actual line closer to the ideal line by day 15. By the sprint’s end, the project is completed on time, thanks to the burndown chart’s insights.
Using Burndown Charts with TaskFord
TaskFord’s project management platform simplifies the creation and use of burndown charts. With real-time task tracking, automated reporting, and customizable dashboards, TaskFord enables teams to generate accurate burndown charts for sprints, releases, or entire products based on the statistics it provides. Key features include:
- Task Management: Define tasks, assign story points, and update statuses to populate burndown charts automatically.
- Real-Time Updates: Ensure charts reflect the latest progress as team members mark tasks complete.
- Analytics and Velocity Tracking: Use historical data to refine estimates and calculate team velocity for better planning.
- Collaboration Tools: Share charts during stand-ups or client meetings to foster transparency and alignment.
By combining burndown charts with TaskFord, teams can monitor progress, address bottlenecks, and deliver projects on time with confidence.
Conclusion: Elevate Your Project Management with Burndown Charts
Burndown charts are a powerful tool for project and task management, offering clear insights into progress, bottlenecks, and team performance. By visualizing work remaining, they help Agile teams stay on track, manage scope creep, and improve forecasting. Whether managing a single sprint or a complex product release, burndown charts provide the transparency and data needed to succeed. With platforms like TaskFord, creating and using burndown charts becomes an integral part of your project management strategy, empowering your team to deliver results efficiently.
Learn more
- Agile Project Management - The Basics For Beginners
- Agile Project Management Sprint Cycle - From Planning to Retrospective
- Gantt Chart 101 - Definition, Key Features, and How to Use It for Project Management

Making work simpler,
smarter, and more connected
Join our waitlist and be notified first.

Related Blog


Subscribe for Expert Tips
Unlock expert insights and stay ahead with TaskFord. Sign up now to receive valuable tips, strategies, and updates directly in your inbox.