Gantt Chart 101: Definition, Key Components, and How to Create It
Discover the basic of Gantt chart, what it is, key components and learn how to create one in step by step guide.
The Gantt chart is a powerful project planning tool, developed in the early 20th century and still widely used today. This guide will walk you through everything you need to know about Gantt charts, from their definition and key components to a step-by-step guide on how to create one.
If you’re looking for a comprehensive and easy-to-understand introduction to Gantt charts, this article is the perfect reference for you. Let’s dive in!
Gantt Chart Definition
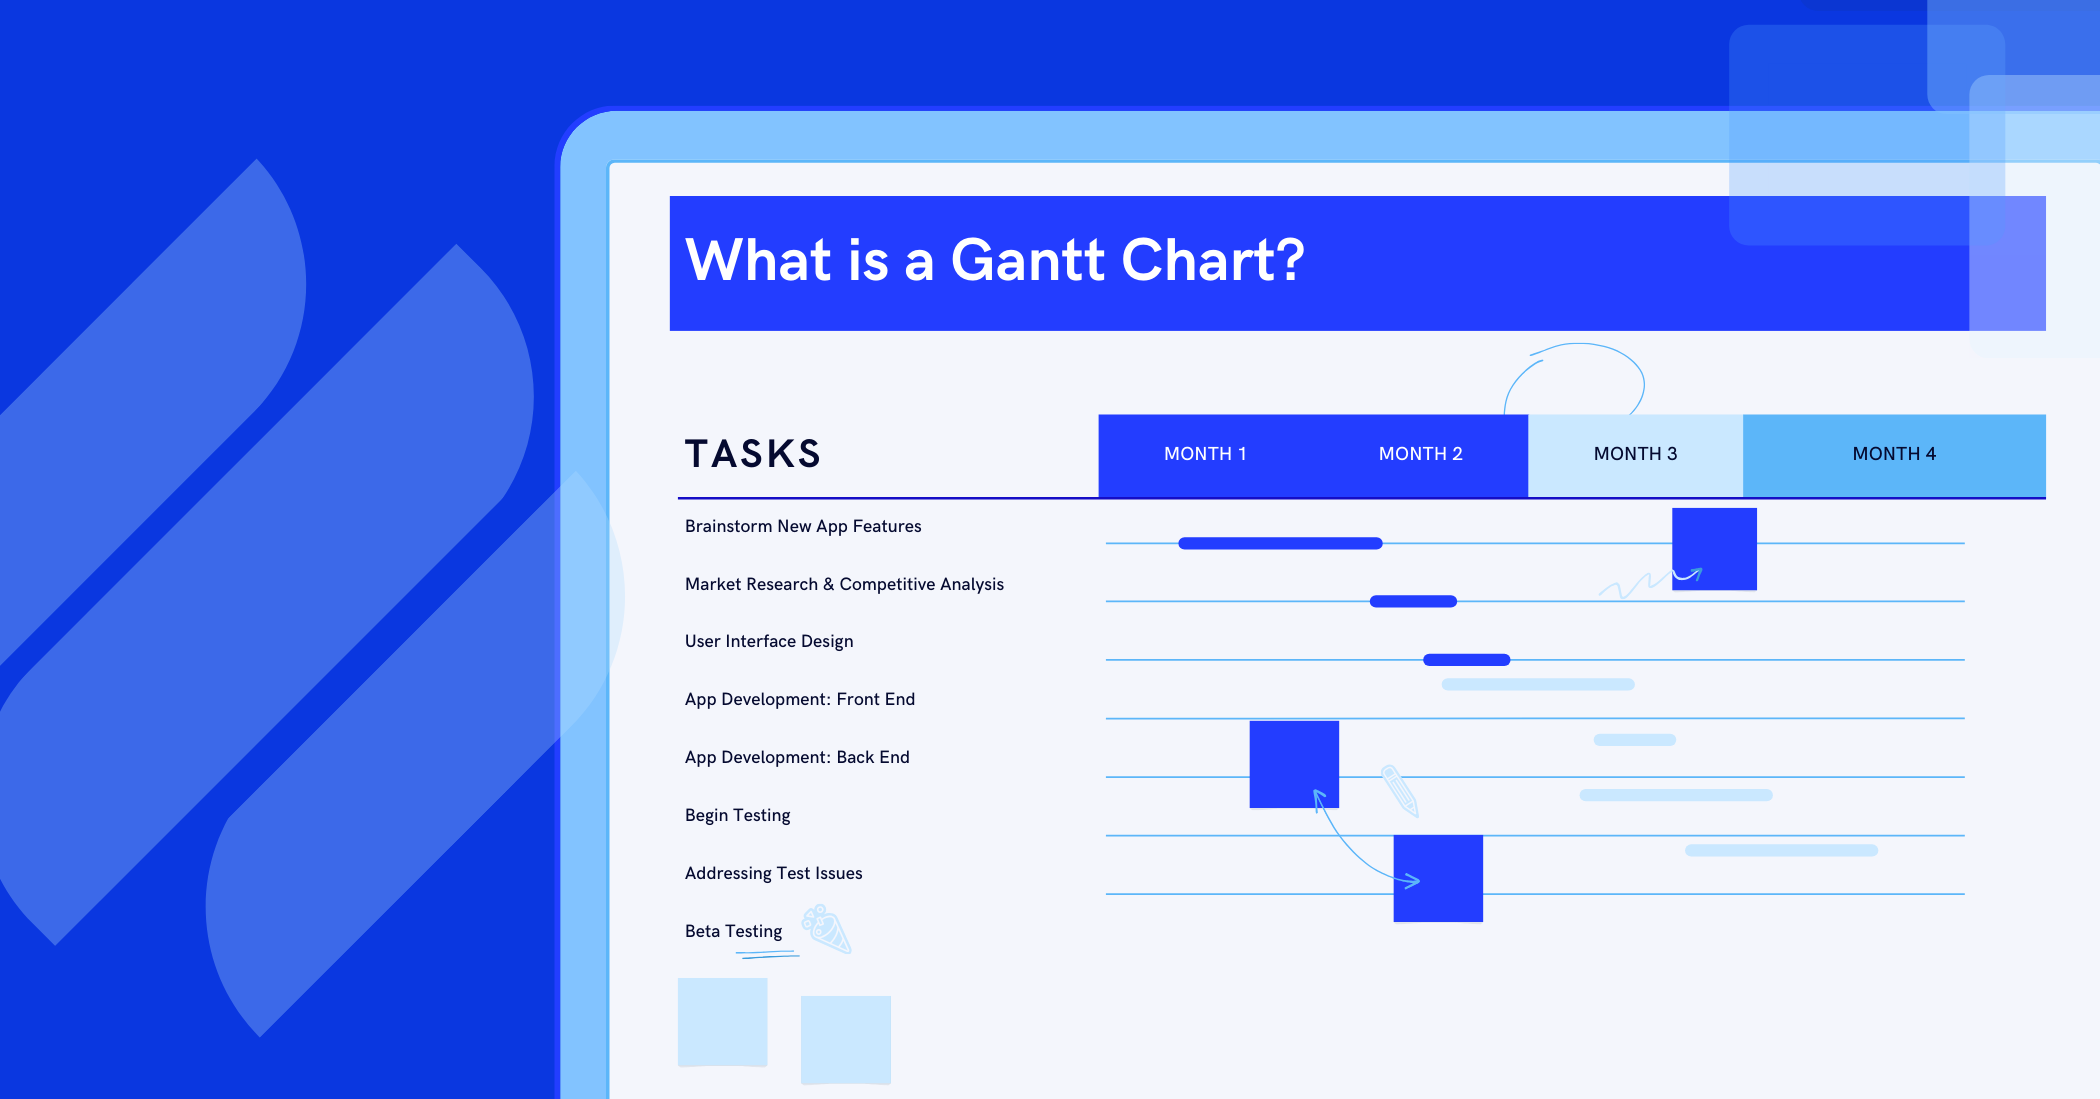
A Gantt chart is a visual tool in project management used to display project tasks over time. In the chart, each task is represented by a horizontal bar, where:
- The position and length of the bar indicate the task’s start date, end date, and duration.
- The color or status of the bar reflects its level of progress.
- The connecting lines or arrows represent dependencies between tasks.
With these features, a Gantt chart enables managers to plan, track progress, and allocate resources more effectively. It is particularly well-suited for projects with a clear sequential structure, such as Waterfall projects or construction projects.
For more details on the history and applications of Gantt charts, check out our article: What is a Gantt Chart? A Comprehensive Guide for Beginners.
Key Components of a Gantt Chart
Basically, a Gantt chart consists of three core components: tasks, a timeline, and Gantt bars that represent the duration of tasks. However, to meet the demands of complex project management, modern Gantt tools have added many advanced components and features, making them much more powerful. Below are the main components of a complete Gantt chart:
1. Tasks

Tasks are the foundation of a Gantt chart, as every other element, such as duration, resources, dependencies, and milestones, ultimately connects back to them. A task represents a specific unit of work that needs to be completed within the project.
Tasks can be organized hierarchically, starting with broad phases (e.g., “Planning,” “Execution,” “Testing”) that are then broken down into smaller, more manageable subtasks. This structure not only clarifies responsibilities but also makes it easier to track progress at both the macro and micro levels.
In the Gantt chart, tasks are listed vertically in a dedicated column on the left side of the chart, serving as a clear and systematic reference point for the entire schedule.
2. Timeline

The timeline, positioned horizontally at the top of the Gantt chart, serves as the x-axis that frames the overall project schedule.
It provides a chronological view of when tasks start and end, making it easier to visualize overlaps and dependencies. Depending on the project’s complexity, the timeline can be adjusted to different time units, such as days for short-term projects, weeks or months for medium-sized initiatives, and quarters or years for large-scale, long-term programs.
The timeline can be horizontally scrolling to accommodate extended project durations, ensuring that even multi-year projects can be displayed clearly without losing detail.
3. Gantt Bars

Gantt bars are the visual centerpiece of the chart. These horizontal bars stretch across the timeline to represent the planned duration of each task, beginning at the task’s start date and ending at its completion date. Each bar is aligned with its corresponding task row, allowing for easy comparison across tasks.
To enhance readability, Gantt bars can often be color-coded based on task type, priority, current status (e.g., “in progress,” “completed”), or assignee. This color differentiation allows managers and stakeholders to quickly identify bottlenecks, task owners, and progress without needing to read through detailed descriptions. Some tools even display task completion percentages directly within the bars for real-time tracking.
4. Milestones

Milestones highlight significant events or checkpoints in a project, such as the completion of a major phase, approval of a deliverable, or the launch of a new feature.
Unlike regular tasks, milestones do not span over time; instead, they are represented as diamond-shaped icons placed at specific date on the timeline.
A milestone serves as quick reference markers for project health, allowing managers and teams to confirm whether they are meeting critical deadlines. They are especially valuable in presentations or stakeholder updates, as they simplify complex schedules into visible progress markers.
5. Dependencies

Dependencies show the relationships between tasks, indicating the order in which tasks must occur. They are usually displayed as arrows linking Gantt bars or milestones, making the flow of work immediately clear.
Correctly defining dependencies helps prevent scheduling conflicts and ensures that the project progresses smoothly. Most Gantt chart software allows users to set dependencies intuitively through drag-and-drop actions.
The four most common dependency types include:
- Finish-to-Start (FS): Task B begins only after Task A finishes.
- Finish-to-Finish (FF): Task B finishes only when Task A finishes.
- Start-to-Start (SS): Task B starts only when Task A starts.
- Start-to-Finish (SF): Task B finishes only when Task A starts.
6. Baseline

A baseline acts as a reference point, shown as a line under the Gantt bar, capturing the original project schedule at a given moment. When changes occur, such as delays or extended durations, the current schedule can be compared against the baseline.
This comparison allows project managers to measure deviations, evaluate the reasons behind them, and assess how they affect overall deadlines. Baselines are particularly useful for reporting, as they provide tangible evidence of whether the project is staying on track or drifting off schedule.
7. Critical Path

The critical path represents the sequence of dependent tasks that collectively determine the project’s minimum completion time. In other words, any delay in a critical path task will directly delay the overall project delivery.
Identifying the critical path helps managers focus on the most time-sensitive tasks, allocate resources strategically, and anticipate risks before they escalate.
Many Gantt chart tools highlight the critical path visually, often in a distinct color,so it stands out from non-critical tasks. This feature ensures that the team is always aware of which activities require the highest priority.
Beyond the Basics
While the elements above form the backbone of a traditional Gantt chart, advanced project management tools often layer on additional features for greater efficiency. These can include real-time progress tracking, automatic task rescheduling when dependencies shift, workload balancing, resource allocation, and integration with communication platforms. Choosing the right set of features depends on the project’s complexity, team size, and management approach. For small teams, a simple Gantt chart may suffice, while larger organizations may benefit from robust tools that combine scheduling, collaboration, and analytics in one platform.
How to Create a Gantt Chart?
Creating an effective Gantt Chart requires a clear understanding of your project’s goals and management needs, followed by selecting the appropriate tool to meet those requirements. For simple needs, such as visualizing a project timeline, tools like Microsoft Excel may suffice. However, for advanced project management tasks, such as tracking dependencies or identifying the critical path, a specialized Gantt Chart tool with robust features is recommended. Below is a detailed, step-by-step guide to creating a Gantt Chart:

Step 1: Define the Project Scope and Break Down Tasks
To begin planning your project, first establish its scope and objectives. This foundational step helps you identify the necessary resources, tasks, sub-tasks, and the estimated overall project duration.
Use a Work Breakdown Structure (WBS) to divide the project into smaller, manageable tasks. The WBS organizes tasks hierarchically, grouping them into phases or deliverables. This breakdown ensures clarity and helps assign responsibilities, making it easier to manage the project’s complexity.
Step 2: Identify Milestones
Milestones are key events or achievements that mark significant progress in the project, such as completing a phase or delivering to a client. These serve as reference points to gauge the project’s progress without needing to monitor every individual task daily. Clearly defining milestones helps maintain focus on critical objectives and ensures the project stays on track.
Step 3: Determine Task Dependencies
Once tasks and milestones are defined, identify the dependencies between them. Not all tasks can be performed independently; some may only start after others are completed. For example, a task might depend on the completion of a prior task (Finish-to-Start dependency). Mapping dependencies also helps prioritize tasks, ensuring critical activities are addressed first to avoid delays.
Step 4: Choose the Right Tool
Selecting an appropriate Gantt Chart tool is critical and depends on your project’s management needs. A tool that lacks necessary features can lead to inefficiencies and wasted time, while an overly complex tool with irrelevant features may increase costs and create usability challenges. For basic projects, tools like Excel or Google Sheets can work. For more complex projects requiring dependency tracking, critical path analysis, or resource management, consider advanced tools like TaskFord, Microsoft Project, Asana, or ClickUp. Evaluate each tool’s features to ensure they align with your project’s requirements.
Step 5: Plan Tasks and Visualize the Chart
The final and most critical step is to plan tasks by assigning durations, resources, and responsible team members. Input each task’s start and end dates into the chosen tool, which will generate horizontal Gantt bars to represent task durations along the timeline.
Incorporate previously identified dependencies and milestones to ensure the chart accurately reflects the project’s structure. Many tools allow you to visually connect tasks with arrows to show dependencies and mark milestones with distinct symbols (e.g., diamonds). Additionally, save the initial plan as a baseline to serve as a reference point for tracking progress and identifying deviations as the project progresses.
By following these steps, you can create a clear and functional Gantt Chart that serves as a roadmap for your project, enhancing planning, coordination, and overall success.
Gantt Chart vs. Other Project Management Tools
Choosing the right project management tools is essential for keeping tasks organized and ensuring project success. While Gantt Charts, Kanban, PERT Charts, and Timeline Views all help manage projects, each has unique strengths and is suited for different types of workflows. Below is a comparison to help you determine which tool best fits your project needs.
| Feature | Gantt Chart | Kanban | PERT Chart | Timeline View |
|---|---|---|---|---|
| Best For | Complex projects with task dependencies and deadlines. | Agile workflows and continuous delivery processes. | Analyzing task dependencies and estimating project duration. | Simple visualization of events over time. |
| Visualization Style | Bar chart with tasks displayed along a timeline. | Board with task cards moving through workflow stages. | Network diagram showing task sequences and dependencies. | Linear timeline marking events or milestones. |
| Collaboration | Strong team coordination through scheduling and task assignments. | Best for team collaboration and adaptive workflows. | Focuses more on analysis than real-time collaboration. | Good for visualizing milestones, but limited task interaction. |
| Project Size | Suitable for large and complex projects. | Ideal for small to medium iterative projects. | Best for highly structured projects with complex dependencies. | Works well for small projects and event planning. |
| Use Cases | Software development, construction, marketing campaigns, and product launches. | Agile software development, content creation, service industries. | Engineering, research, and critical decision-making projects. | Roadmaps, event planning, product launch timelines. |
| Ease of Use | Moderate learning curve, requires setup. | Easy to use with intuitive drag-and-drop functionality. | Requires technical knowledge of critical path analysis. | Very easy, but limited in features. |
Final Thoughts
The Gantt chart remains one of the most effective and widely used project management tools. However, not all projects approach Gantt charts in the same way; it depends on the team’s management style and specific needs. Identifying the right requirements is essential to choosing the appropriate tool. This way, you can build Gantt charts and manage costs more efficiently.
The guide above has provided a basic overview of Gantt charts. If you are new to this field, we recommend checking out our article: What is Project Management?. It will give you a solid understanding of project management fundamentals and suitable methodologies before deciding to use a Gantt chart.

Making work simpler,
smarter, and more connected
Join our waitlist and be notified first.

Related Blog


Subscribe for Expert Tips
Unlock expert insights and stay ahead with TaskFord. Sign up now to receive valuable tips, strategies, and updates directly in your inbox.