Gantt Chart for Multiple Projects: Step-by-Step Guide with Examples
Create a Gantt chart for multiple projects with this expert guide. Learn practical steps and examples using TaskFord for streamlined project management.
Managing several projects at once can quickly become overwhelming without a centralized way to track tasks, timelines, and dependencies. A well-designed multi-project Gantt chart offers a clear, structured approach to planning and execution. In this guide, you’ll learn a step-by-step method for building an effective Gantt chart for multiple projects, complete with practical examples and insights on how TaskFord streamlines the process.
If you’re unfamiliar with the fundamentals of Gantt charts, start with our Gantt Chart 101 primer to get up to speed.
Why Gantt Charts Are Essential for Managing Multiple Projects
When juggling multiple projects, it becomes challenging to visualize timelines, manage resource allocation, and track dependencies. A well-structured Gantt chart gives you a bird’s-eye view of everything in motion.
According to ResearchGate, an empirical analysis focusing on developing countries revealed that sectors such as construction, IT, and manufacturing exhibit high adoption rates of Gantt charts. This is attributed to the structured nature of their projects, where Gantt charts enhance visibility and control over project timelines and task sequencing.
The Complexity of Multi-Project Planning
Multiple teams, overlapping deliverables, shared resources, and interdependent tasks all add layers of complexity. Without a visual system, things fall through the cracks. Gantt charts eliminate guesswork by laying everything out on a shared timeline.
Benefits of Using a Gantt Chart
- Visual clarity: View all project tasks and timelines in one place.
- Task dependencies: Easily identify critical paths and overlaps.
- Resource allocation: Prevent overallocation or resource clashes.
- Milestone tracking: Keep stakeholders informed with clear progress updates.
How to Create a Gantt Chart for Multiple Projects
Managing multiple projects in parallel requires more than just listing tasks, it demands a cohesive, coordinated approach to planning, execution, and monitoring. Below is a comprehensive walkthrough designed to help you develop a scalable and efficient Gantt chart for multi-project environments.
Step 1. Choose the Right Tool for Manage Multiple Projects in a Gantt View
Start by selecting a tool that supports managing and visualizing multiple projects within a single Gantt chart. TaskFord is purpose-built for this, offering features like cross-project task tracking, dependency management, and workload balancing - all in one place. With TaskFord, teams can view timelines, adjust schedules, and assign resources across multiple projects more efficiently.
If you prefer not to use a dedicated tool, you can also create a multi-project Gantt chart using Excel. While this approach is more accessible, it requires more manual updates and lacks built-in capabilities for managing dependencies or resource conflicts across projects. Learn how to make a Gantt chart in Excel.
Step 2. Group Related Projects into Programs or Portfolios
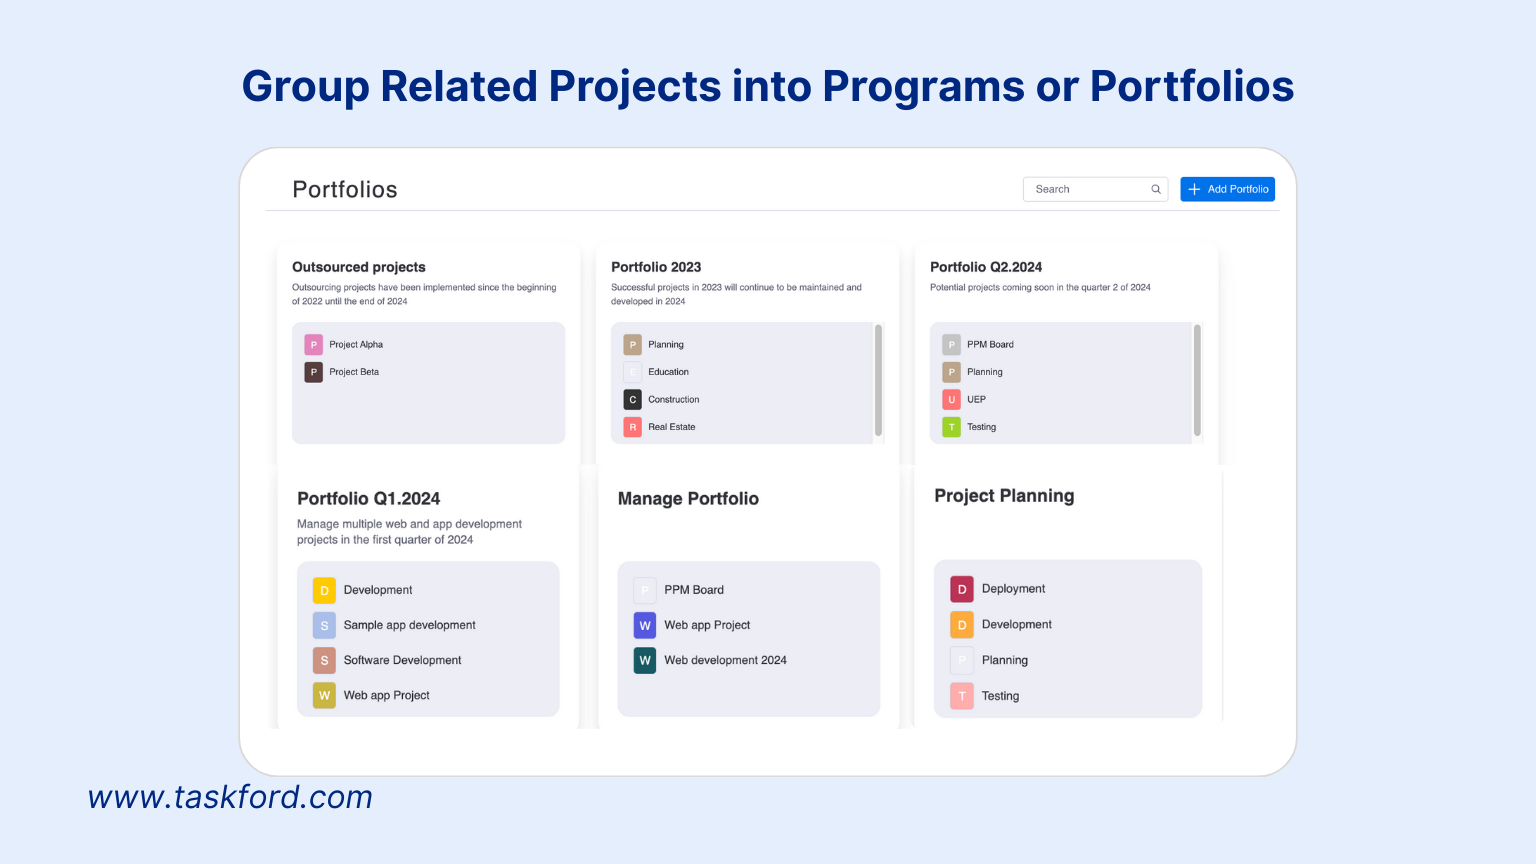
Grouping related projects into programs or portfolios is an essential step for maintaining clarity and control in a multi-project environment. By organizing projects based on business objectives, timelines, or functional areas, you create a structured overview that aligns efforts with strategic goals.
This approach enables better coordination between initiatives that share dependencies, deliverables, or teams. It also improves decision-making by providing visibility into how individual projects contribute to broader outcomes. From a resource management perspective, grouping helps identify overlaps and allocate personnel and budgets more efficiently.
Step 3. Break Projects into Tasks with a Hierarchical Structure
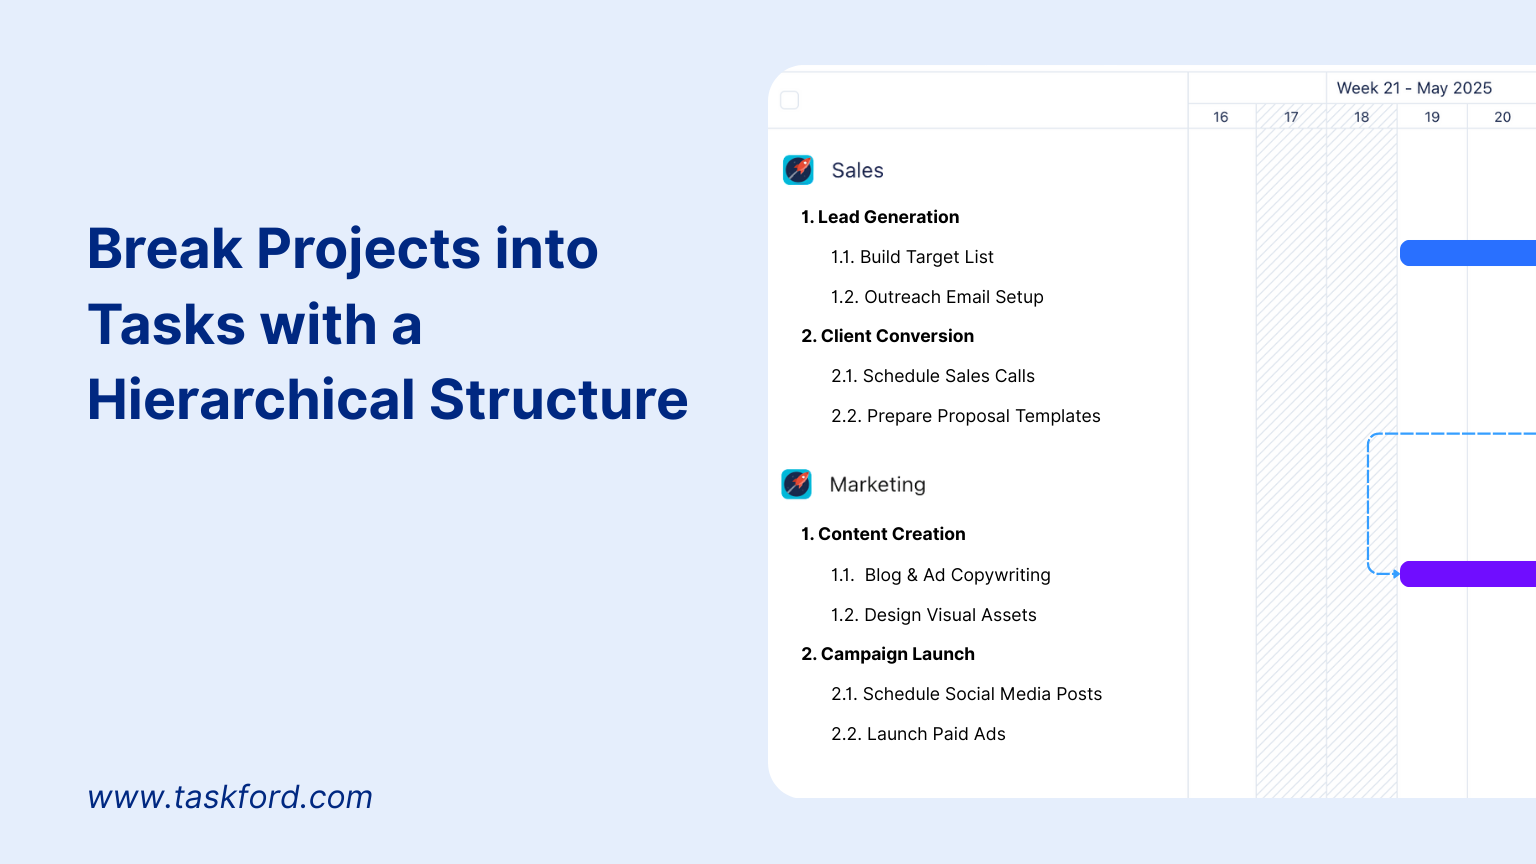
Breaking projects into smaller, manageable tasks is essential for effective planning and control. This process is commonly structured as a Work Breakdown Structure (WBS), which provides a clear hierarchy of deliverables and tasks. When combined with a Gantt chart, a WBS Gantt chart offers a powerful way to visualize project scope, schedule, and dependencies all in one view.
Dividing each project into phases, workstreams, tasks, and subtasks allows you to assign realistic durations, priorities, and responsible team members to each item. This level of detail improves scheduling accuracy and accountability across your projects.
Step 4. Define Task Dependencies and Identify Key Milestones Across Projects
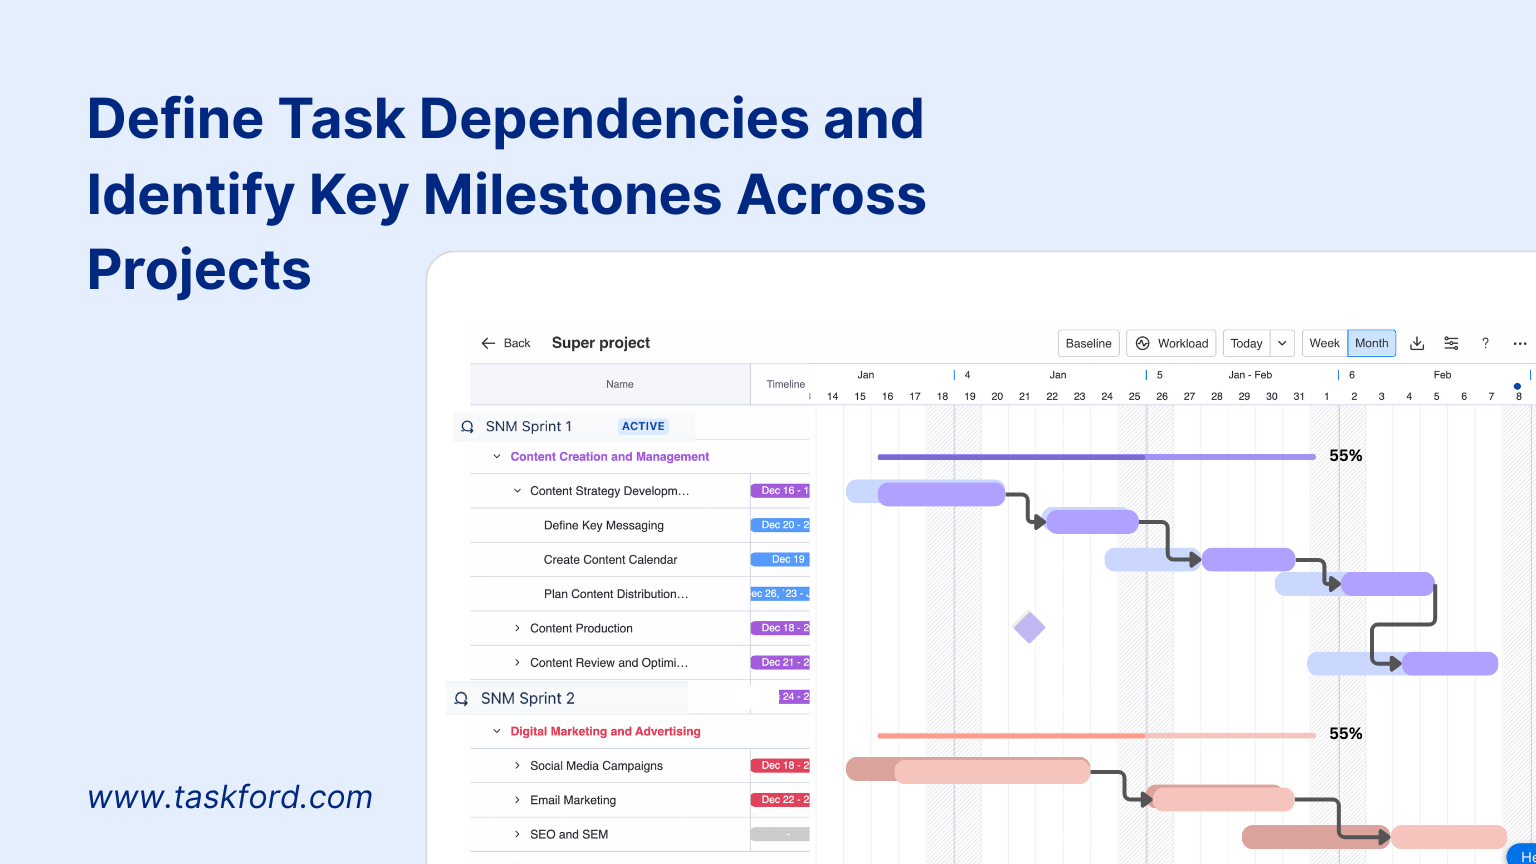
Understanding how tasks relate to each other is critical for accurate scheduling and risk management. Define dependencies to specify which tasks must be completed before others can start, helping you map the workflow and avoid delays.
Alongside dependencies, identifying key milestones is essential. Milestones mark significant points in the project timeline such as phase completions, approvals, or delivery dates. They act as checkpoints to track progress and ensure alignment across projects.
Together, task dependencies and milestones help reveal the critical path—the sequence of tasks that directly impacts project completion. Managing this path effectively reduces risks of missed deadlines.
Step 6. Assign Resources Strategically Across Projects
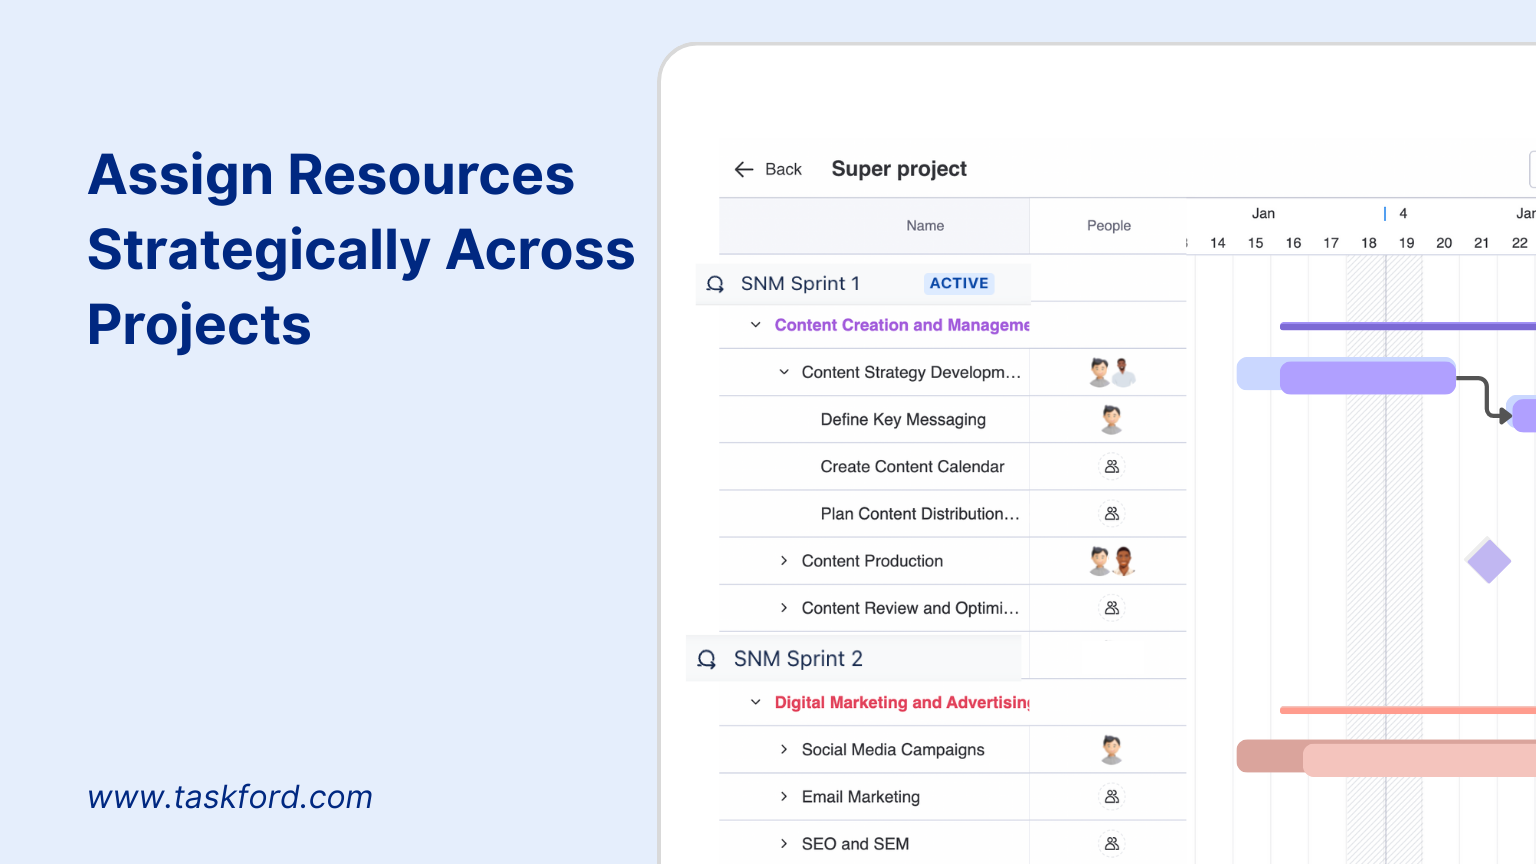
Effectively managing resources across multiple projects in a Gantt chart is crucial to maintaining productivity and preventing burnout. With team members often contributing to several projects at once, it's important to have a clear view of availability and workload before assigning tasks.
- Review each team member’s capacity to ensure assignments are reasonable and aligned with their skill set.
- Prioritize tasks based on overall business objectives and project urgency.
- Identify overlapping resource demands early to avoid conflicts and delays.
Step 7. Build and Maintain the Gantt Chart View for Multiple Projects
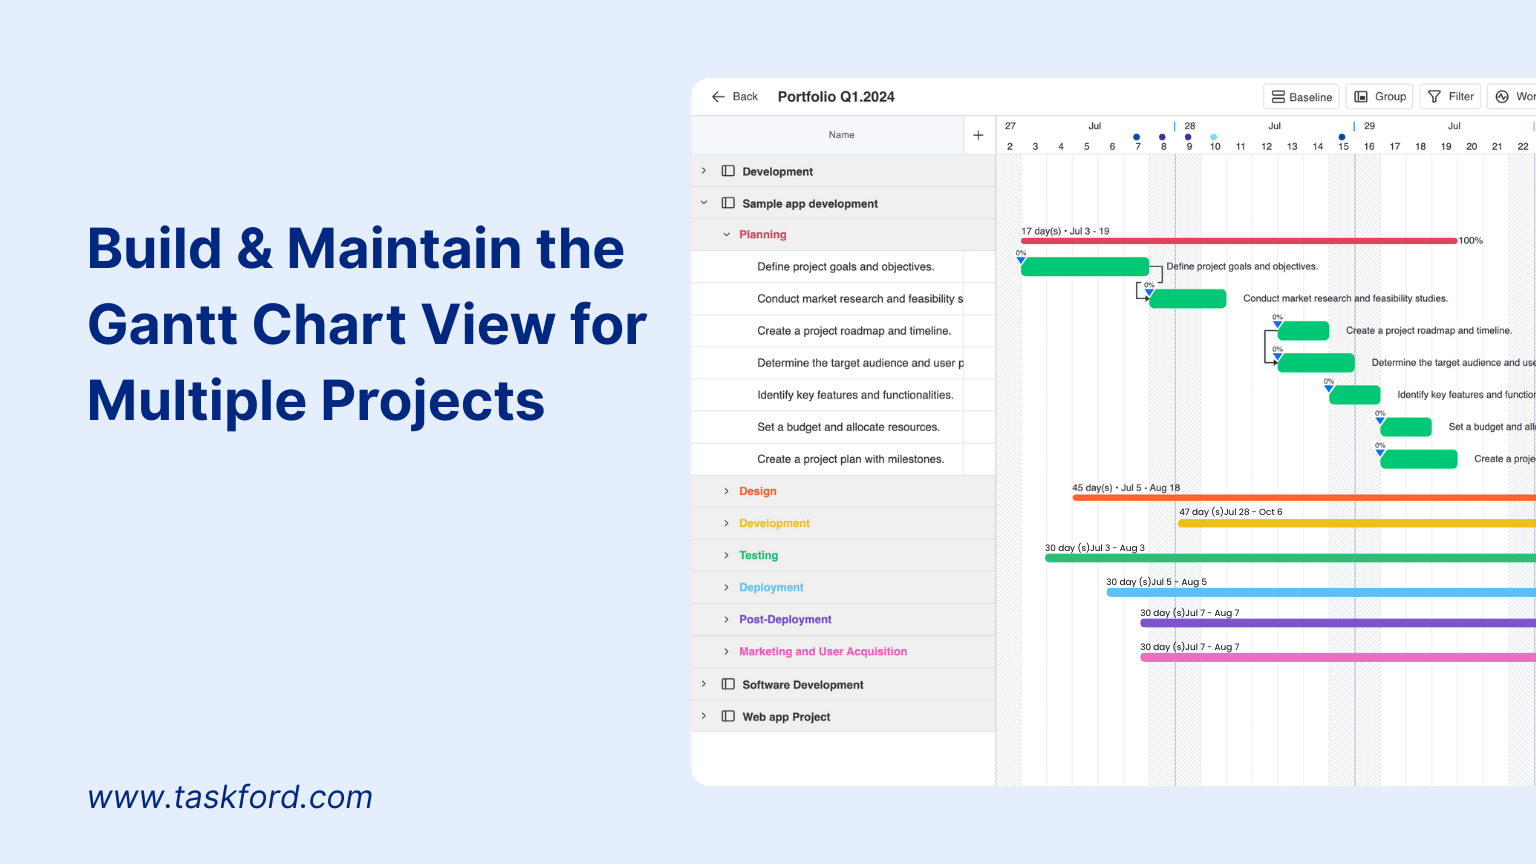
Bringing together your project timelines into one unified Gantt chart gives a comprehensive view of all ongoing initiatives. This master chart allows you to spot potential overlaps, track dependencies, and coordinate efforts more effectively.
- Use consistent formatting, color-coding, or labeling to differentiate projects within the chart.
- Group related tasks or phases across projects to make comparisons easier.
- Highlight milestones and critical paths to focus attention on time-sensitive items.
With TaskFord’s project management feature, you can create a consolidated Gantt view that reflects the latest changes across projects, keeping everyone aligned. Regularly maintaining this view helps stakeholders understand progress, anticipate risks, and make informed decisions.
Step 8. Monitor Progress and Adjust as Needed
A Gantt chart isn’t just a planning tool, it’s also essential for execution and oversight. Keeping your chart updated ensures it reflects real-time conditions and remains a reliable source of truth.
- Set a cadence for reviewing the chart, such as weekly check-ins or milestone-based reviews.
- Update task statuses, adjust durations, and revise dependencies as projects evolve.
- Use filters to focus on specific teams, projects, or timeframes.
- Capture key updates with task-level notes to maintain context.
TaskFord enables real-time updates and collaborative inputs, so teams can respond quickly to changes and stay aligned across the portfolio. By continuously monitoring and refining your chart, you improve agility and keep execution on track.
Example of a Gantt Chart for Multiple Projects Using TaskFord
Let’s look at a practical example of how TaskFord visualizes multiple projects in a single Gantt chart.
In this case, the portfolio includes two related initiatives: Sales and Marketing. Each project is organized using a clear Work Breakdown Structure (WBS), with phases, tasks, and subtasks displayed in a hierarchical format on the left.
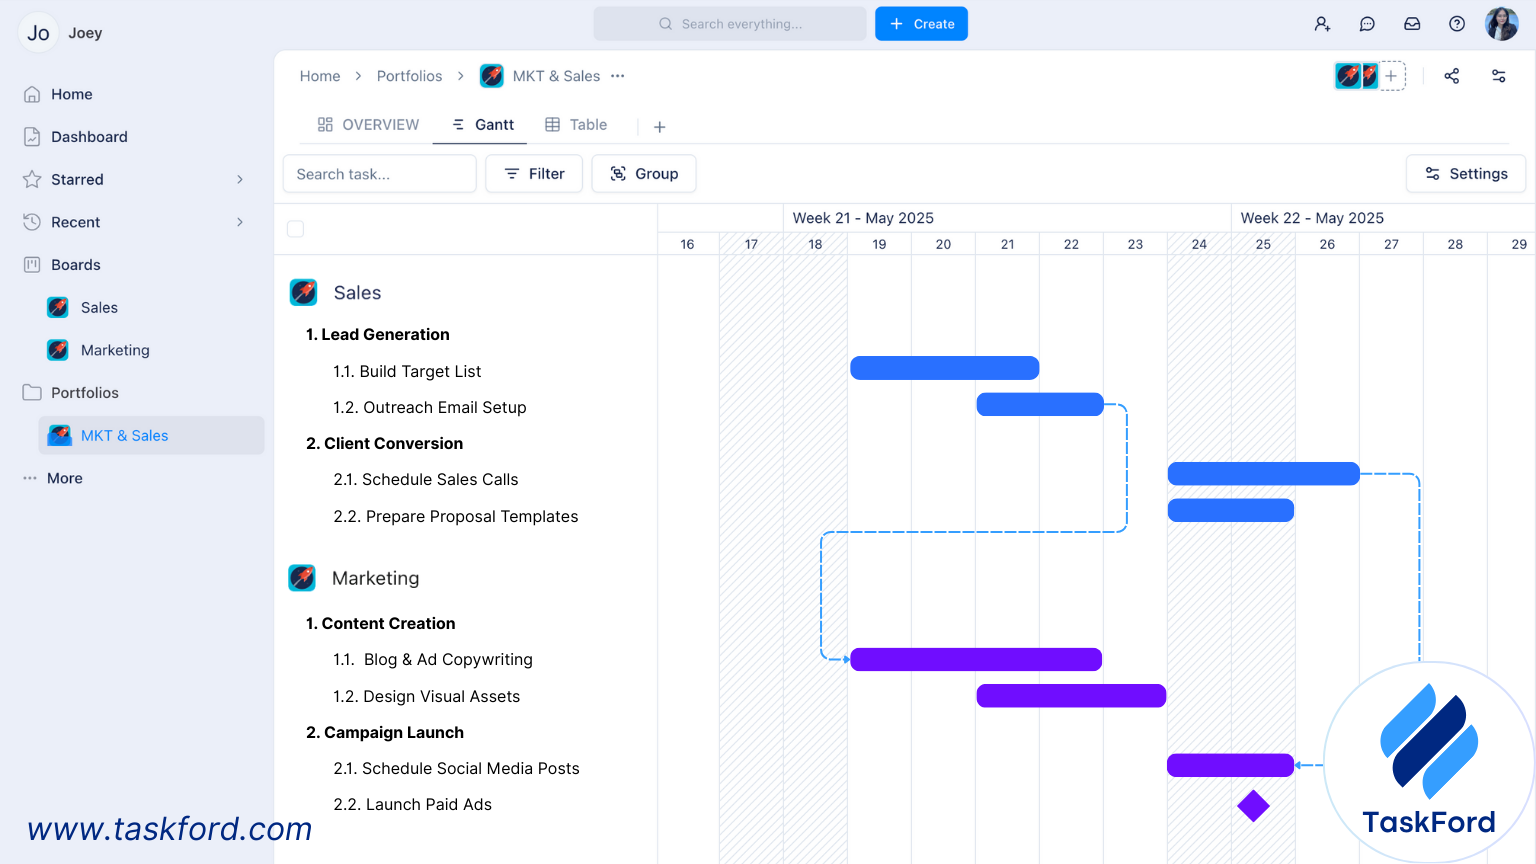
On the right, the Gantt view shows:
- Parallel Timelines: Tasks from both Sales and Marketing projects are scheduled over the same two-week period, allowing for direct comparison and coordination.
- Task Dependencies: Dashed lines connect related tasks across projects—for example, Marketing’s “Launch Paid Ads” depends on earlier Sales activities. This helps teams anticipate delays and align deliverables.
- Milestone Markers: A milestone icon indicates a key event, such as a campaign launch or major handoff, providing a visual checkpoint for progress tracking.
- Color-Coded Bars: Tasks are color-coded by project for quick visual distinction between workstreams.
- Grouped Portfolios: Both Sales and Marketing are grouped under the “MKT & Sales” portfolio, making it easy to manage initiatives that contribute to shared business outcomes.
This view gives project managers a unified timeline, improves cross-functional planning, and helps stakeholders track the status of multiple projects in one place. TaskFord’s Gantt capabilities reduce manual overhead while offering real-time updates, making it easier to maintain alignment and drive execution.
Final Thoughts
Managing multiple projects without a clear visual structure can lead to missed deadlines, resource conflicts, and misaligned teams. A Gantt chart for multiple projects solves this by providing a centralized, real-time view of every initiative in flight. From grouping projects into portfolios to defining dependencies and tracking milestones, each step in the Gantt process helps bring order to complexity.
Whether you're overseeing two projects or twenty, tools like TaskFord make it easier to plan, monitor, and adjust, without the manual overhead. With built-in features for cross-project visibility, workload balancing, and collaborative updates, TaskFord turns your Gantt chart into a living system that drives execution.
Looking for a broader foundation in project planning? Visit our Project Management Guide for practical frameworks and expert tips to strengthen your overall project management approach.

Making work simpler,
smarter, and more connected
Join our waitlist and be notified first.


Subscribe for Expert Tips
Unlock expert insights and stay ahead with TaskFord. Sign up now to receive valuable tips, strategies, and updates directly in your inbox.