What is the Work Breakdown Structure (WBS) Gantt Chart? A complete guide
Learn how a WBS Gantt Chart merges task hierarchy with a visual timeline for better project management. Improve planning, tracking, and team collaboration!
A WBS Gantt Chart is a project management tool that combines the structured breakdown of tasks with a visual timeline. By integrating the Work Breakdown Structure (WBS) with a Gantt Chart, teams can better organize tasks, track dependencies, and manage project milestones efficiently.
In this guide, we’ll break down how this method works, its key advantages over a standard Gantt Chart, and step-by-step instructions to create one. Whether you're handling a software project, marketing campaign, or large-scale construction plan, mastering this approach will help streamline project execution and improve team collaboration.
Understanding the WBS Gantt Chart
What is a Gantt Chart?
A Gantt Chart is a visual project management tool that displays tasks along a timeline, making it easy to track schedules, dependencies, and progress. Typically represented as a horizontal bar chart, it helps teams understand when tasks start and end, which activities overlap, and how different project phases connect.
This tool is widely used in project planning because it provides a clear visual structure, helping teams stay aligned on deadlines and dependencies. To learn more about how they work and why they are essential in project management, check out our detailed guide on What is a Gantt Chart.
What is Work Breakdown Structure (WBS)?
A Work Breakdown Structure (WBS) is a hierarchical framework that organizes a project into smaller, manageable components. Instead of listing tasks sequentially, like in a Gantt Chart, a WBS arranges work into a structured format that breaks down the entire project scope into defined deliverables.
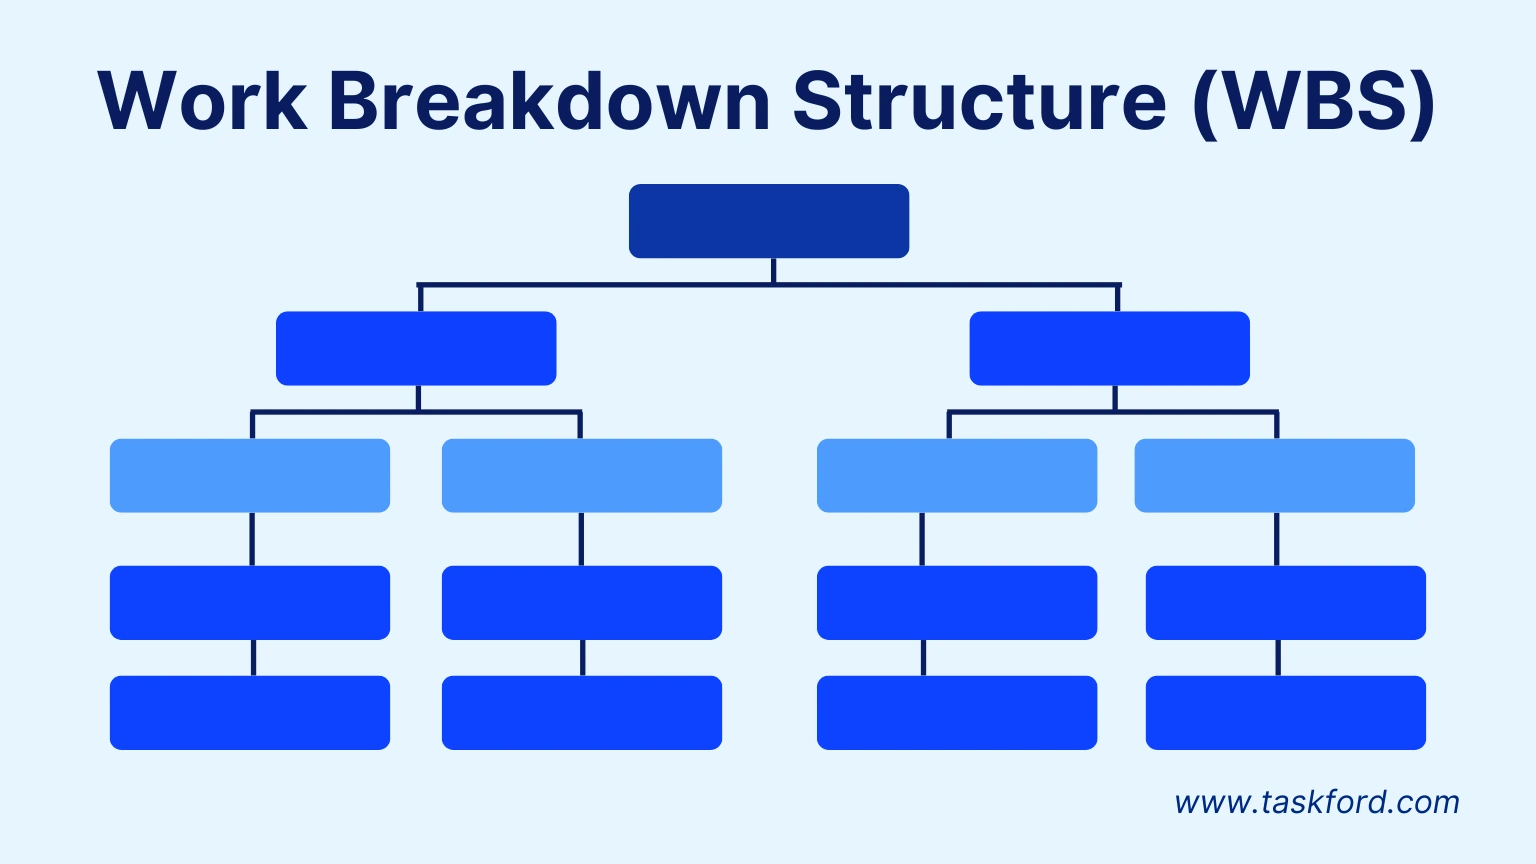
Key Components of a WBS:
- Project Objective – The final goal or deliverable of the project.
- Major Phases – Broad categories of work, such as planning, development, and testing.
- Work Packages – Smaller units of work under each phase that can be assigned to team members.
- Task Dependencies – Relationships between work packages that determine the project flow.
A WBS timeline ensures that every part of a project is accounted for, reducing the risk of overlooked tasks. It also helps project managers allocate resources effectively and improve task prioritization.
How WBS Relates to Task Hierarchy
The structure of a WBS follows a top-down approach, breaking the project into progressively smaller work items. This hierarchy ensures that large, complex projects are systematically divided into manageable sections, making planning and execution more efficient. When combined with a Gantt Chart, this structured breakdown creates a task hierarchy chart, providing both a clear visual timeline and a logical order for project execution.
How Does WBS Work in a Gantt Chart?
A WBS Gantt Chart merges the structured approach of a Work Breakdown Structure with the timeline-based visualization of a Gantt Chart. By integrating these two methods, project managers can see both the hierarchical structure of tasks and their scheduling on a single visual interface.
How Integration Works:
- WBS Defines the Structure: The project is broken down into phases, sub-tasks, and work packages.
- Gantt Chart Adds the Timeline: Each task is assigned a duration, dependencies, and milestones.
- Tasks Are Scheduled Sequentially: The workflow follows the dependencies set in the WBS framework.
- Progress Tracking Becomes Visual: As work progresses, the Gantt Chart reflects real-time updates, showing which tasks are on track or delayed.
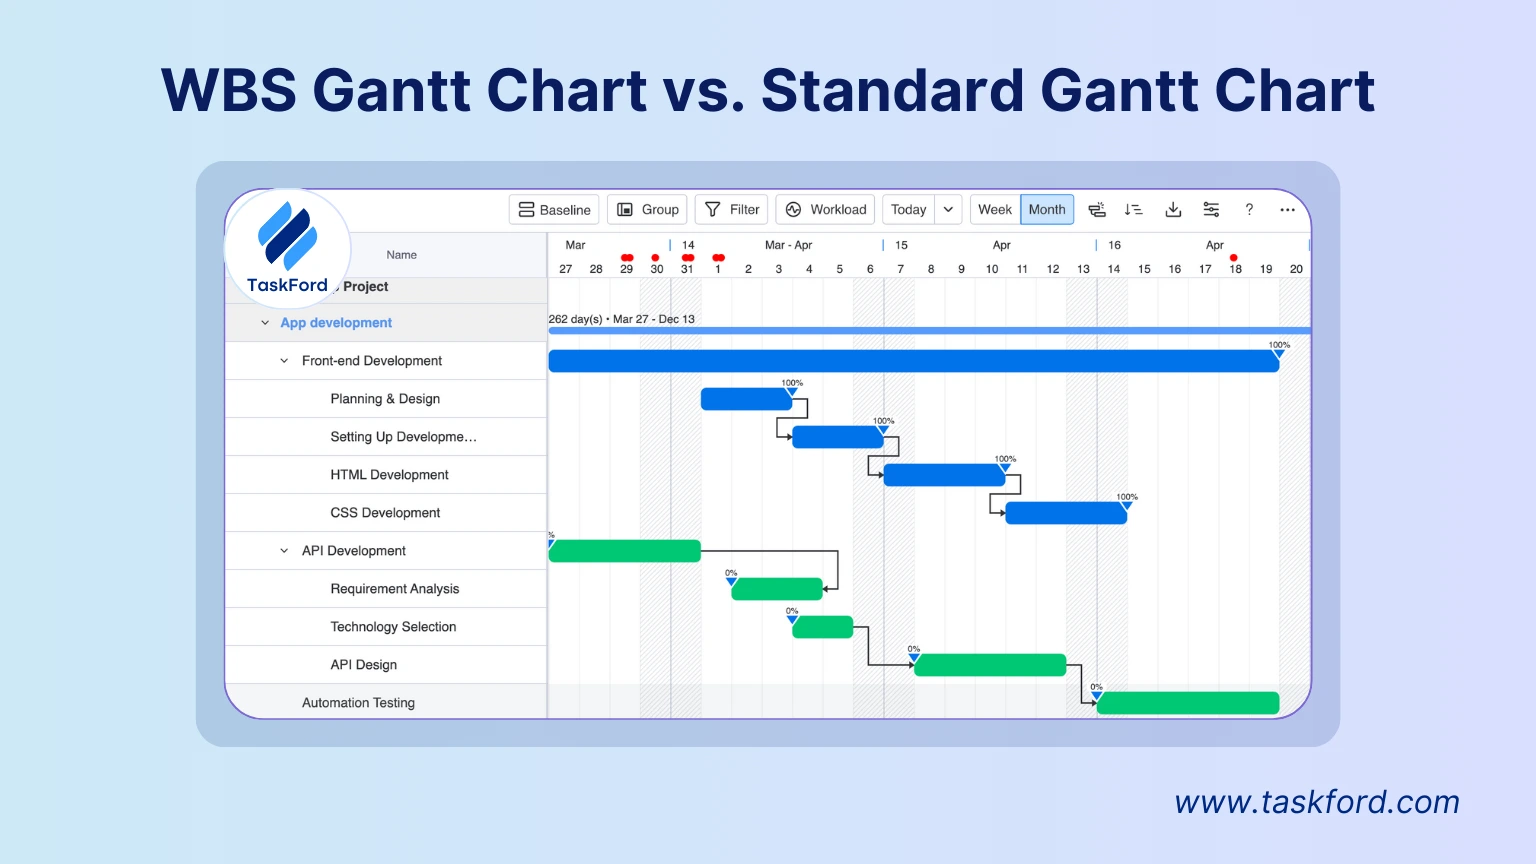
WBS Gantt Chart vs. Standard Gantt Chart: What’s the Difference?
At first glance, a Gantt Chart and a WBS Gantt Chart may seem similar, but their underlying structures serve different purposes. While both provide a timeline-based view of project tasks, a WBS timeline integrates a structured breakdown of tasks, making it more efficient for complex projects.
Key Differences Between a Standard Gantt Chart and a WBS Gantt Chart
| Feature | Standard Gantt Chart | WBS Gantt Chart |
|---|---|---|
| Structure | Lists tasks sequentially | Uses a hierarchical breakdown (WBS) |
| Task Organization | Tasks are listed based on dependencies | Tasks are grouped into work packages |
| Visibility | Focuses on time and deadlines | Emphasizes project structure and dependencies |
| Best Use Case | Simple projects with linear workflows | Complex projects with multiple dependencies and phases |
Why Project Managers Prefer a WBS Gantt Chart
- Better task visualization: The task hierarchy chart makes it easier to see how different work packages contribute to the project.
- Improved dependency management: A WBS timeline ensures tasks are logically structured and properly sequenced.
- Scalability for complex projects: Large projects benefit from an organized breakdown instead of an overwhelming task list.
- Enhanced resource planning: Work packages help distribute workload efficiently across teams.
For projects requiring both structure and time management, a WBS Gantt Chart offers the best of both worlds, ensuring that tasks are not just scheduled but also organized efficiently.
How to Create a WBS Gantt Chart? (Step-by-Step Guide)
Creating a WBS Gantt Chart involves breaking down a project into work packages and visualizing them along a timeline. Follow these steps to build an efficient task hierarchy timeline for your project:
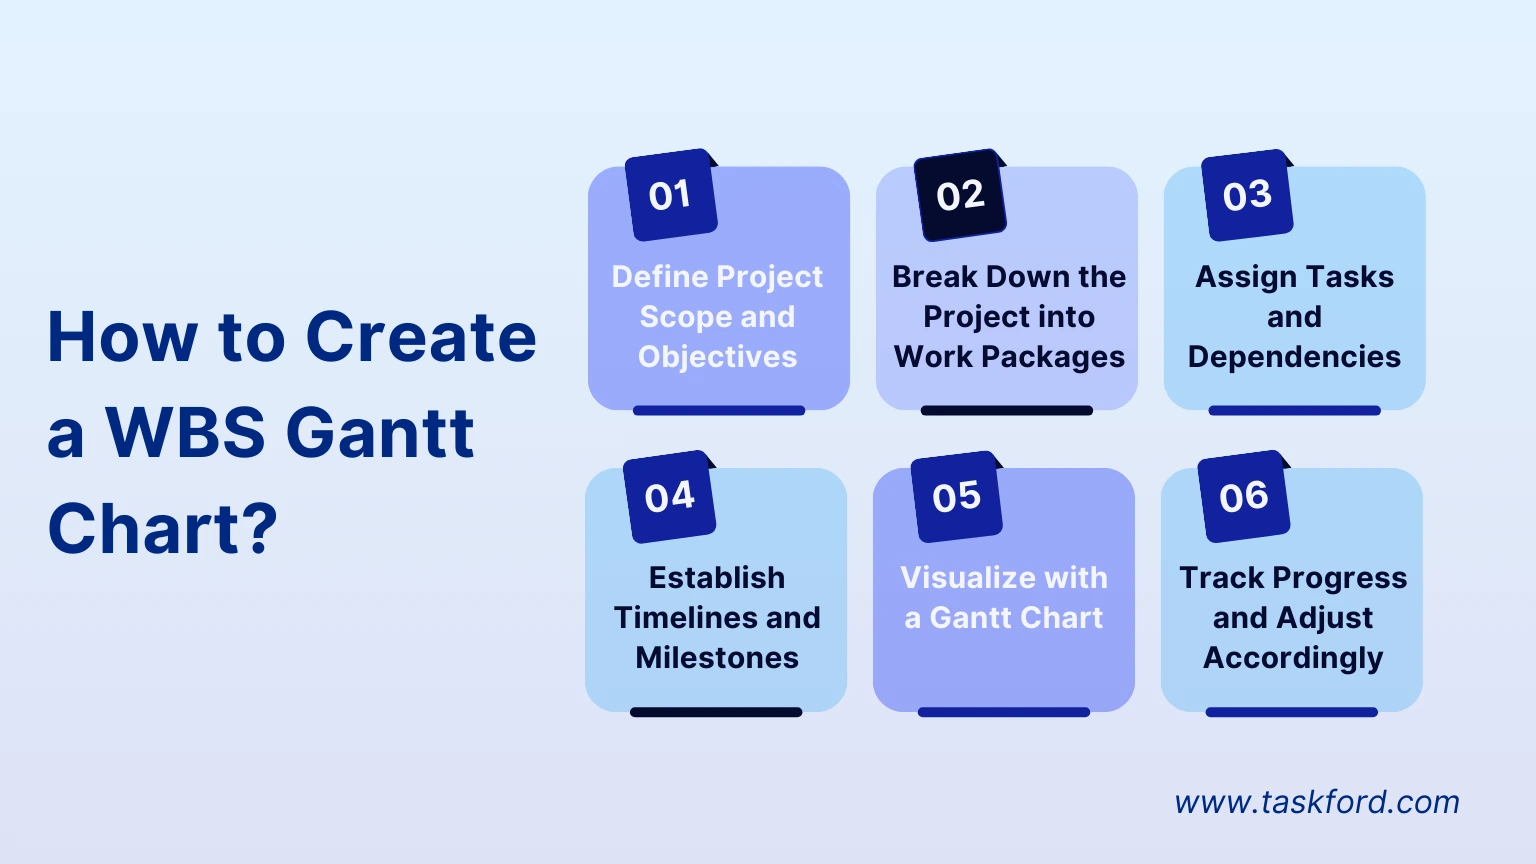
Step 1: Define Project Scope and Objectives
- Identify the overall project goal.
- Outline key deliverables and expected outcomes.
Step 2: Break Down the Project into Work Packages
- Divide the project into phases or categories (e.g., planning, execution, testing).
- Within each phase, define smaller tasks that contribute to the final deliverable.
Step 3: Assign Tasks and Dependencies
- Determine which tasks depend on others to be completed first.
- Assign tasks to specific team members or departments.
Step 4: Establish Timelines and Milestones
- Set realistic start and end dates for each work package.
- Identify major milestones, such as approvals or completion points.
Step 5: Visualize with a Gantt Chart
- Use a project management tool (e.g., TaskFord) to input tasks into a timeline.
- Arrange tasks in hierarchical order, ensuring dependencies are clear.
Step 6: Track Progress and Adjust Accordingly
- Regularly update the WBS Gantt Chart to reflect progress.
- Adjust timelines if project conditions change.
By following these steps, teams can transform a complex project into an organized, manageable workflow, ensuring deadlines are met without unnecessary stress.
Use Cases: How WBS Gantt Chart is Used in Project Management?
A WBS Gantt Chart is highly versatile and can be applied across different industries. Let’s look at how it works in three key sectors:
1. Construction Project Management
- Project Scope: Building a commercial office.
- WBS Breakdown: Planning → Site Preparation → Foundation → Framing → Interior Finishing → Inspection.
- Gantt Chart Application: Each phase is assigned a timeframe, dependencies (e.g., the foundation must be complete before framing starts), and resources.
2. Software Development
- Project Scope: Developing a new mobile app.
- WBS Breakdown: Research → UI/UX Design → Backend Development → Testing → Deployment.
- Gantt Chart Application: Tasks like "backend development" and "UI design" may run in parallel but converge during integration testing.
3. Marketing Campaign Execution
- Project Scope: Launching a new product.
- WBS Breakdown: Market Research → Content Creation → Advertising → Social Media Outreach → Product Launch.
- Gantt Chart Application: Ensuring ad creatives are ready before paid campaigns start, while PR activities run simultaneously.
WBS Gantt Chart vs. Other Project Management Tools: Which One is Better?
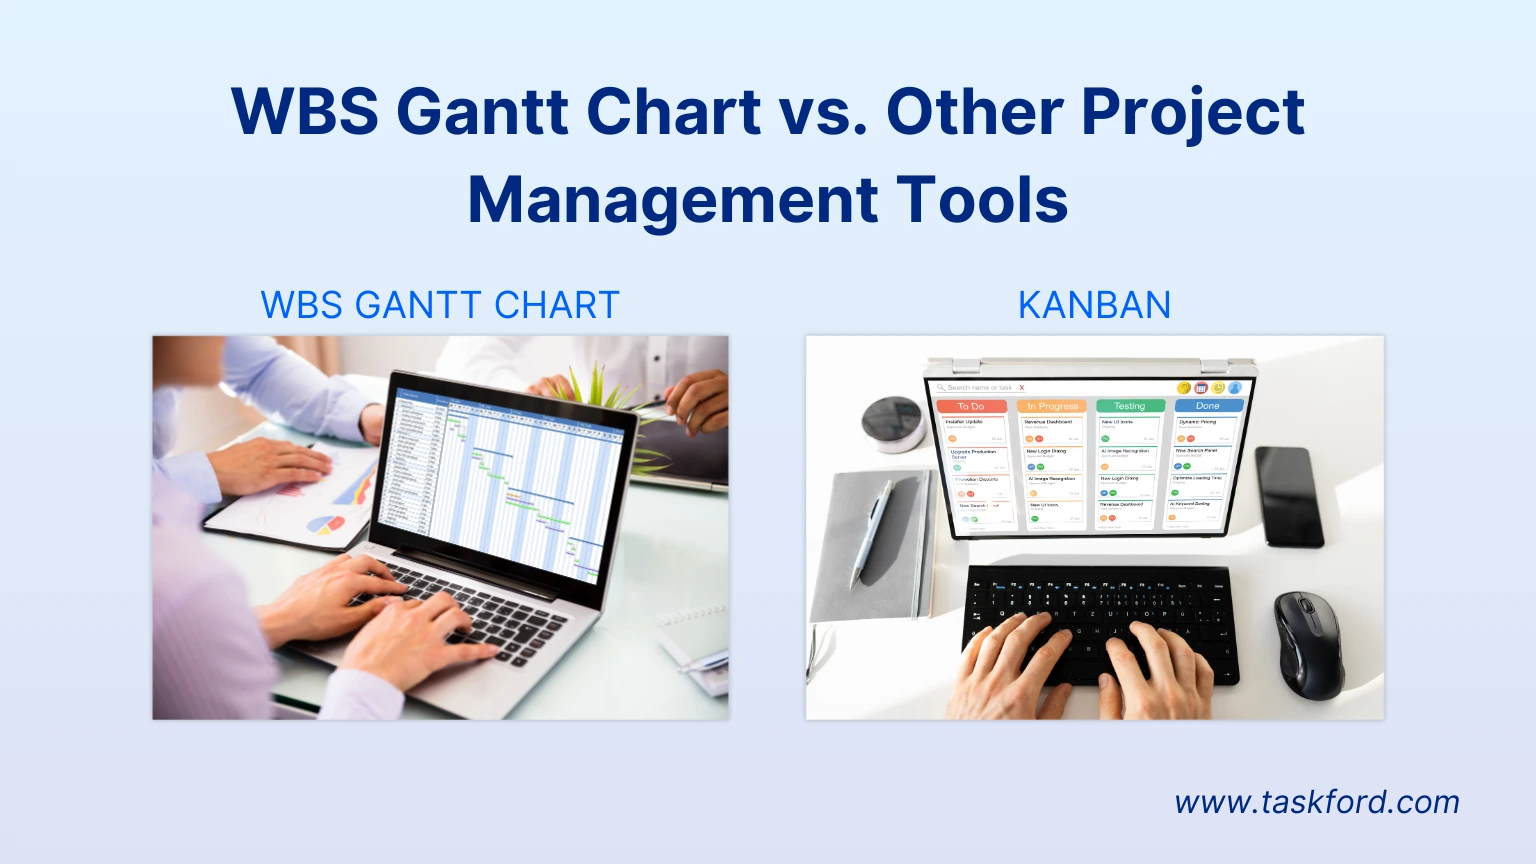
While a WBS Gantt Chart is an excellent tool for structured planning, other project management methodologies also offer value. Here’s how it compares:
| Feature | WBS Gantt Chart | Agile/Kanban |
|---|---|---|
| Best for | Large, structured projects | Flexible, iterative workflows |
| Task Management | Task hierarchy with dependencies | Continuous task flow |
| Time tracking | Fixed deadlines and schedules | Adaptive timeframes |
| Resource Allocation | Clearly defined work packages | Dynamic workload adjustments |
When to Use a WBS Gantt Chart vs. Other Tools:
- Use a WBS Gantt Chart for projects with a clear start and end date, structured phases, and multiple dependencies (e.g., construction, product launches).
- Use Agile/Kanban for iterative development, where tasks evolve over time (e.g., software development sprints).
Conclusion & Final Thoughts
A WBS Gantt Chart offers a structured approach to project management by merging task hierarchy and timeline-based planning. Whether managing a construction project, a software development life cycle, or a marketing campaign, this approach ensures better organization, clearer dependencies, and efficient execution.
By using a task hierarchy chart with a Gantt timeline, teams can track progress effectively, allocate resources smartly, and minimize delays.

Making work simpler,
smarter, and more connected
Join our waitlist and be notified first.

Related Blog


Subscribe for Expert Tips
Unlock expert insights and stay ahead with TaskFord. Sign up now to receive valuable tips, strategies, and updates directly in your inbox.