How to Make a Gantt Chart in Projects Using Project Management Tools
Learn how to make a Gantt chart in projects using a project management tools like TaskFord, Jira and Monday.com.
In our previous articles, we introduced the key concepts and basic components of a Gantt Chart. In this guide, we’ll take a deeper dive into how to create a Gantt chart for your projects. We’ll also provide practical instructions on how to do this using popular project management tools like TaskFord, Jira, and Asana.
Why Use Project Management Tools to Create Gantt Charts?
Gantt charts have long been a popular tool for planning and managing projects. However, for modern project managers, simply creating a Gantt chart isn’t enough. Their role often involves tracking and managing resources, such as resource capacity, time utilization, and costs, factors that can heavily influence the project.
Moreover, using Gantt charts to track tasks in detail can be overwhelming for those managing multiple projects at once. They often need a high-level tool that provides quick updates on the status of a project via dashboards or resource usage reports.
For this reason, many project managers turn to comprehensive project management tools that integrate Gantt charts, allowing them to centralize project data without the need to switch between multiple tools. As a result, most project management tools now include Gantt chart features to meet the needs of project managers.
However, it’s important to note that the choice of a project management tool for creating Gantt charts depends on the needs and goals of your team. For small teams or less complex projects, simpler tools without resource management features may suffice. You can even use Excel or Google Sheets for creating Gantt charts. These tools often come at a lower cost compared to full-scale project management software.
If you're interested in creating a Gantt chart in Excel, check out our guide: How to Make a Gantt Chart in Excel.
How to Make a Gantt Chart in Projects
Let’s explore how to create Gantt charts in your projects using popular project management tools.
1. Create a Gantt Chart Using TaskFord
TaskFord is a comprehensive project management platform that’s great for teams of all sizes. It offers a simple, easy-to-use interface for managing projects or portfolios. TaskFord allows you to manage tasks across multiple views, like table, Kanban, Gantt chart, scheduler, and calendar. The data is synchronized across all views, so you can switch between them seamlessly.
Additionally, TaskFord provides customizable dashboards that allow you to get a comprehensive overview of your projects. The tool is still new, which means you can try it for free. In the future, it will support advanced features such as time tracking, timesheets, resource capacity planning, and vacation management, which will help you manage your project resources more efficiently.

Here’s how to create a Gantt chart using TaskFord:
- First, create a TaskFord account. Go to TaskFord, click on "Free Trial," and create a site for your organization. Follow the instructions to create a board and invite your team members.
- Once the board is created, you can access the Gantt chart feature from the board view. If you manage multiple projects, create a portfolio to group your boards into one view, then access the Gantt chart.
- In the Gantt chart, click “New Task” to create tasks. Here, you can plan directly by assigning tasks to team members and setting start and end dates. You can also leave these blank and assign them later after creating the tasks.
- For larger tasks, create subtasks to break them down for better management. The Gantt chart will automatically display tasks in a hierarchical structure.
- On the right side of the table, simply click and drag along the timeline to plan the task with start and end dates.
- You can also drag the start or end points of a task to another task to set up dependencies.
- In the customization section, you can find features like auto-scheduling, critical path, and more. You can also filter or group by fields to customize the Gantt view for your project.
2. Create a Gantt Chart Using Jira
Jira, developed by Atlassian, is a popular project management tool favored by agile teams. It offers various project management views like Kanban boards, calendars, list views, and timelines. However, Jira does not have a built-in Gantt chart feature; you’ll need to install a plugin or app from the Atlassian Marketplace, such as ProScheduler or Ganttable, to enable Gantt chart functionality.

Here’s how to set it up:
- Go to the Atlassian website and choose the Jira software to create a site for your organization, then invite team members.
- After setting up your site, you can create projects with specific tasks. Similar to TaskFord, you can create tasks, subtasks, and different levels of tasks to break down work.
- In the app section, select “Explore More Apps” and search for the Gantt chart plugin, or you can visit the Atlassian Marketplace to find and install a plugin. Note that some plugins are free, while others require a paid subscription. However, you’ll typically get a free trial (usually 30 days). In this case, we’ll guide you through installing the ProScheduler plugin.
- After installing ProScheduler, you can access it from the app section. There, you’ll see the projects you’ve created in Jira under "Project."
- Access your project, and you’ll find an option for the "Team Board" (the ProScheduler plugin you installed). Click on the “Gantt” tab.
- In the Gantt chart, you’ll see all the tasks created in your Jira project. You can also create new tasks and arrange them in a specific structure.
- On the right side, simply click on the date corresponding to the timeline to plan tasks, including assigning start and end dates. You’ll then see the Gantt bars corresponding to your tasks.
- You can drag the start and end points of the Gantt bars to set dependencies. Above the timeline, you’ll find additional features like critical path and baseline.
3. Create a Gantt Chart Using Monday.com
Monday.com is another powerful project management tool that offers Gantt charts as part of its built-in features. It’s a popular choice for teams that need a visually appealing interface for project tracking and task management.

To create a Gantt chart in Monday.com:
- If you don't have an account, go to Monday.com and sign up for a new account.
- Once you log in, you'll land on your dashboard. Click on the “+ New Workspace” button to create a workspace for your projects.
- After creating a workspace, click on the “+ New Board” button to create a new board. You can choose to start from scratch or use one of Monday.com's pre-built templates
- Once your board is created, start adding tasks, assign a member, and plan with a start and end date
- To see your project’s timeline, click on the “View” button in the upper-right corner of your board. From the dropdown menu, select “Gantt”. You'll see a visual representation of your tasks, with each task represented by a horizontal bar on the timeline.
- You can also customize your Gantt chart, like set task dependencies, track progress, color-code task,...
Best Practices for Gantt Chart Design
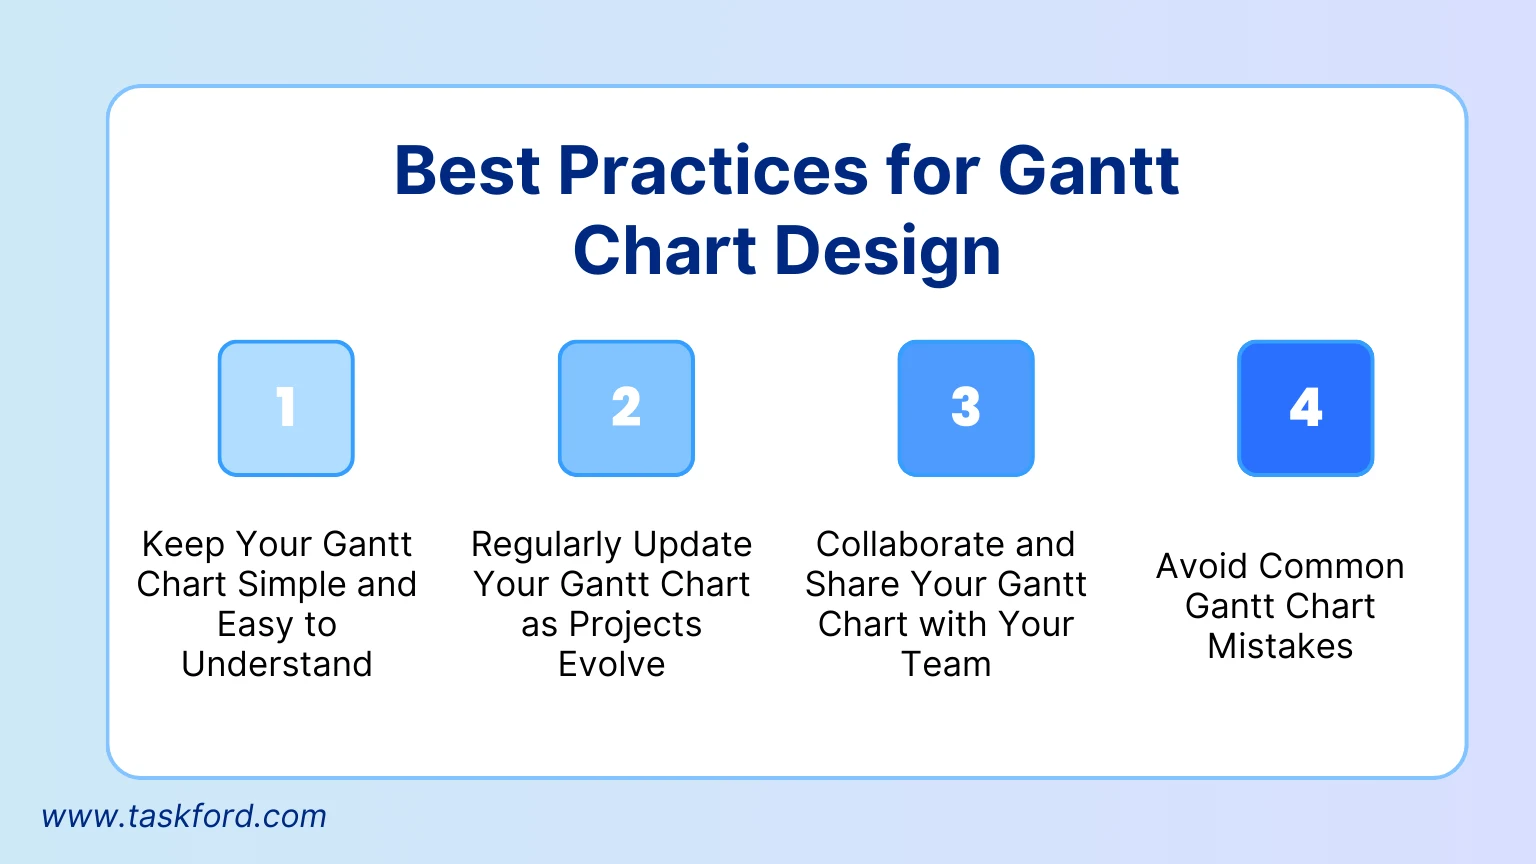
- Keep Your Gantt Chart Simple and Easy to Understand: A Gantt chart should be clear and straightforward, focusing only on essential tasks, milestones, and dependencies while using visual aids like color coding or grouping to make it easy to read.
- Regularly Update Your Gantt Chart as Projects Evolve: Regular updates ensure your Gantt chart remains accurate and relevant by reflecting changes in timelines, tasks, and priorities as the project progresses.
- Collaborate and Share Your Gantt Chart with Your Team: Sharing your Gantt chart with your team fosters collaboration and accountability by providing everyone with access to the latest version and encouraging real-time feedback.
- Avoid Common Gantt Chart Mistakes: To ensure effectiveness, avoid overcomplicating your Gantt chart, overlooking dependencies, neglecting milestones, or failing to update it regularly as the project evolves.
Conclusion
Gantt charts are an invaluable tool for project managers to plan and visualize tasks effectively. Most modern project management tools now include Gantt chart features, making it easier for managers to oversee resources and factors affecting the project while keeping track of progress in real-time. Choosing the right tool is crucial; selecting a tool that matches your team’s needs will help you fully leverage its capabilities. On the other hand, using a tool that is either underpowered or overly complex can waste both time and money. This guide has provided a quick walkthrough of using tools like TaskFord, Jira, and Monday.com to create Gantt charts. Follow the steps and try out each tool to determine which one best suits your needs.

Making work simpler,
smarter, and more connected
Join our waitlist and be notified first.

Related Blog


Subscribe for Expert Tips
Unlock expert insights and stay ahead with TaskFord. Sign up now to receive valuable tips, strategies, and updates directly in your inbox.