How to Measure Sprint Velocity Accurately in Agile Projects?
Learn how to measure and track Sprint Velocity accurately in Agile projects to improve planning, forecasting, and team performance.
Measuring sprint velocity is one of the simplest yet most powerful ways Agile teams can forecast their work and improve delivery predictability. At its core, sprint velocity tells you how much work your team can complete in a single sprint — but getting that number right isn’t always as straightforward as it seems. Inaccurate measurements can lead to unrealistic commitments, missed deadlines, and unnecessary stress for the team.
In this guide, we’ll break down what sprint velocity really means, why accuracy matters, and the exact steps to measure it correctly. Whether you’re new to Agile or looking to fine-tune your team’s metrics, you’ll walk away with practical tips and examples to track it with confidence.
What is Sprint Velocity?
Sprint Velocity is an Agile metric that represents the amount of work a team can complete during a single sprint. It’s most often measured in story points, which are units used to estimate the effort required to complete tasks in the sprint backlog.
The calculation is straightforward: at the end of a sprint, you total the story points for all fully completed work items – only those meeting the team’s Definition of Done count toward Sprint Velocity.
For example:
If your team completes three user stories worth 8, 5, and 13 story points, your Sprint Velocity for that sprint is 26 story points.
It isn’t about speed for speed’s sake — it’s a planning tool. By tracking velocity over several sprints, teams can forecast future capacity, make more realistic commitments, and maintain a sustainable pace. It also provides valuable insight into trends, such as whether a team’s output is stabilizing, increasing, or declining over time.
Understanding how a sprint works is essential before diving deeper into Sprint Velocity. You can learn more in our detailed guide: Agile Project Management Sprint?
Why Measuring Sprint Velocity Accurately Matters
Accurate Sprint Velocity measurement is the foundation of effective Agile planning. When you know exactly how much work your team can deliver in a sprint, you can make realistic commitments, set achievable goals, and maintain a sustainable pace.
Here’s why it matters:
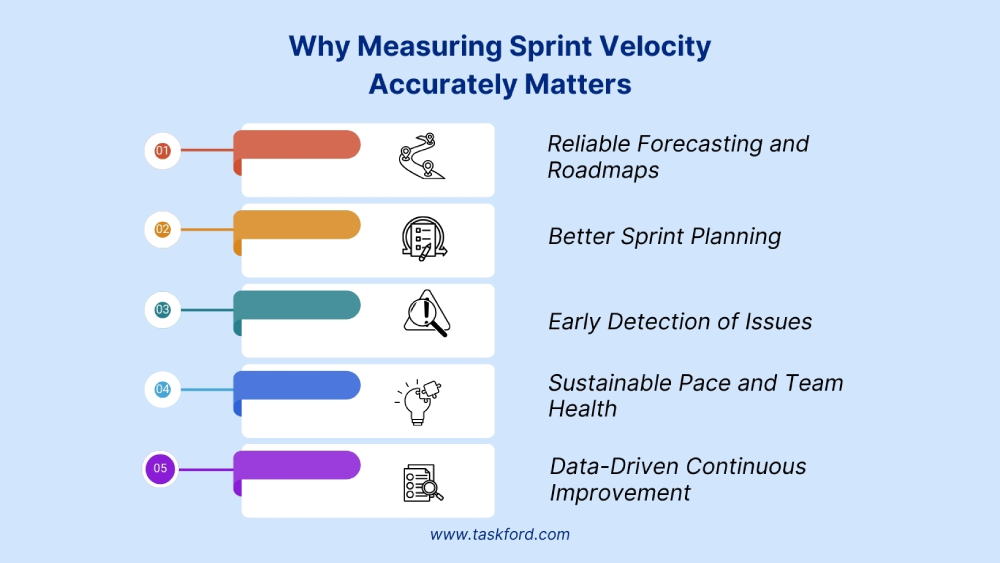
1. Reliable Forecasting and Roadmaps
- With accurate velocity data, teams can estimate how many sprints are needed to deliver a backlog or reach a major milestone.
- Product owners and stakeholders gain realistic timelines, reducing the risk of unpleasant surprises late in the project.
2. Better Sprint Planning
- Knowing your true capacity means you can set sprint goals that match reality, not wishful thinking.
- This prevents overcommitting, which often leads to missed sprint goals and reduced morale.
Read Also: Sprint Planning - An Advanced Agile Guide for Project Managers.
3. Early Detection of Issues
- Velocity trends can act as an early warning system.
- A sudden drop might indicate scope creep, technical blockers, or reduced team capacity, while unexplained spikes could mean inconsistent estimation methods.
4. Sustainable Pace and Team Health
- By aligning the sprint workload with proven capacity, teams can work at a steady pace without burnout.
- Consistent velocity supports a healthier work environment, where quality is prioritized over rushed deliveries.
5. Data-Driven Continuous Improvement
- Over time, analyzing velocity trends can help teams refine their estimation techniques, improve collaboration, and streamline workflows.
- This data becomes a benchmark for assessing the impact of process changes.
In short, measuring Sprint Velocity accurately ensures you’re making decisions based on reality, not guesswork. It’s one of the simplest ways to bring clarity, predictability, and confidence to Agile delivery.
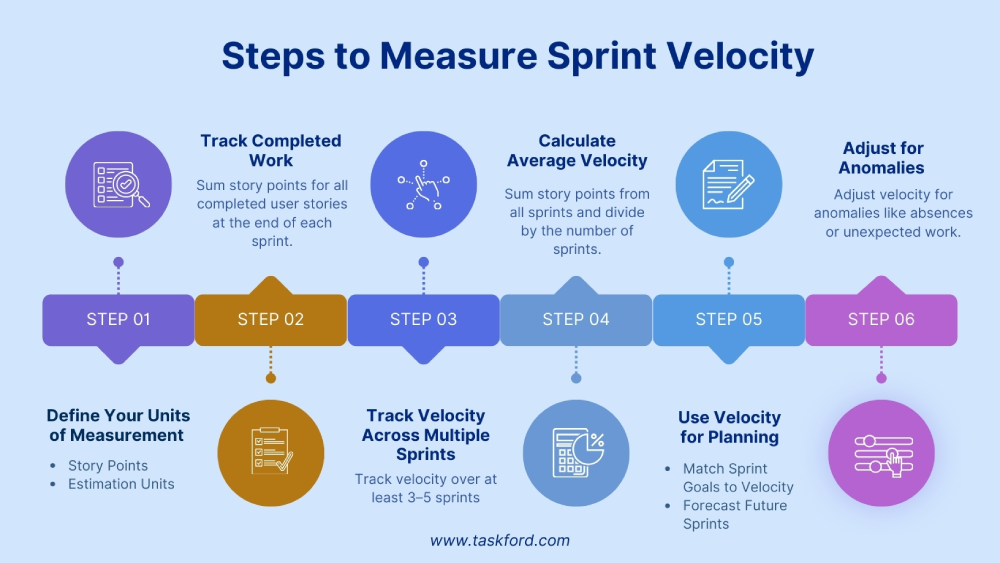
Step-by-Step to Measure Sprint Velocity
Measuring Sprint Velocity is straightforward, but accuracy depends on a consistent process. Follow these steps to ensure your numbers truly reflect your team’s capacity:
Step 1: Define Your Units of Measurement
Before you track Sprint Velocity, decide how your team will estimate work.
- Story Points – The most common approach. Story points measure relative effort, considering complexity, uncertainty, and work size.
- Ideal Hours or Days – Time-based estimates of how long tasks are expected to take (less common in Agile but still used by some teams).
- Custom Estimation Units – Any unique unit your team agrees on, as long as it’s applied consistently.
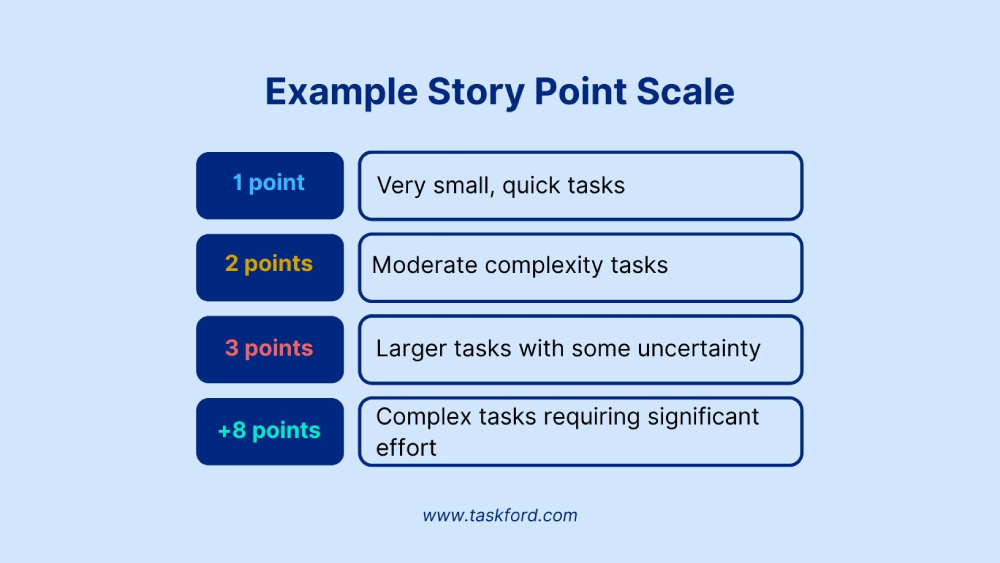
Example Story Point Scale:
- 1 point = very small, quick tasks
- 3 points = moderate complexity tasks
- 5 points = larger tasks with some uncertainty
- 8+ points = complex tasks requiring significant effort
Tip: Pick one method and stick with it — changing estimation units mid-project makes velocity data unreliable.
Step 2: Track Completed Work
The key to accurately measuring Sprint Velocity is to only count fully completed work. This means that at the end of each sprint, you should tally the story points for all items that meet your team’s Definition of Done (DoD).
What is the Definition of Done? Your Definition of Done is a shared understanding within the team about what constitutes a “finished” task. It ensures consistency and clarity so that everyone knows when a task is truly complete and ready for delivery. For instance:
- All code must be reviewed and merged into the main branch.
- Unit tests must pass, and integration tests must be successful.
- Documentation must be updated.
- The task must be deployed to staging for review.
Step 3. Track Velocity Across Multiple Sprints
A single sprint’s velocity doesn’t give a complete picture. Sprint velocity can fluctuate based on factors like task complexity, team availability, and blockers. To get a reliable measure, track velocity over at least 3–5 sprints. This accounts for natural variations and better reflects your team’s capacity.
Step 4: Calculate Average Velocity
Once you’ve tracked completed story points for multiple sprints, calculate your average Sprint Velocity. This gives you a more accurate measure of your team’s capacity for future planning.
How to Calculate Average Velocity:
- Add up the completed story points from all the tracked sprints.
- Divide the total by the number of sprints.
Example Calculation:
| Sprint | Completed Story Points |
|---|---|
| Sprint 1 | 24 points |
| Sprint 2 | 28 points |
| Sprint 3 | 22 points |
| Sprint 4 | 30 points |
Average Velocity = (24 + 28 + 22 + 30) ÷ 4 = 26 points
Your average Sprint Velocity is 26 points, which you’ll use for forecasting and sprint planning.
Step 5: Use Velocity for Planning
With your average Sprint Velocity, you can now make more informed decisions about future sprints.
How to Use Velocity for Planning:
- Match Sprint Goals to Velocity: Ensure your sprint backlog doesn’t exceed your team’s average velocity. For example, if your average velocity is 26 points, plan for 26 story points or fewer in the upcoming sprint.
- Forecast Future Sprints: Use your average velocity to estimate how many sprints will be required to complete the remaining work in the backlog.
Example: If your backlog has 130 points and your average velocity is 26 points, you can estimate 130 ÷ 26 = 5 sprints to complete it.
Tip: Keep in mind that velocity can vary based on factors like team changes or unplanned work, so adjust your planning accordingly.
Step 6: Adjust for Anomalies
While Sprint Velocity is a powerful metric, it’s important to account for any anomalies or unique circumstances that may skew your data. These could include:
- Team Member Availability: Holidays, sick leave, or team changes can impact your velocity.
- Unplanned Work: Urgent tasks or production issues that divert focus from sprint goals.
- Complex or Unpredictable Tasks: Some sprints may have unusually large or complex tasks that cause fluctuations in velocity.
How to Adjust for Anomalies:
- Document any anomalies in your tracking so they can be considered when reviewing velocity trends.
- If a sprint’s velocity was significantly impacted by factors outside the team’s control (e.g., unexpected blockers or team member absences), consider excluding that sprint from your average velocity when forecasting future sprints.
Example: If Sprint 3 had a velocity of 15 points due to unexpected blockers (e.g., a server outage), you may decide to exclude it from the average and only use Sprint 1, Sprint 2, and Sprint 4 for planning.
By adjusting for anomalies, you ensure that your Sprint Velocity remains a reliable and actionable metric for future planning and forecasting.
How to Visualize Sprint Velocity
Visualizing Sprint Velocity can make it easier to spot trends, track progress, and communicate performance to stakeholders. Charts and graphs allow teams to quickly see how their velocity changes over time, identify patterns, and adjust strategies for future sprints. Below are some effective ways to visualize Sprint Velocity:
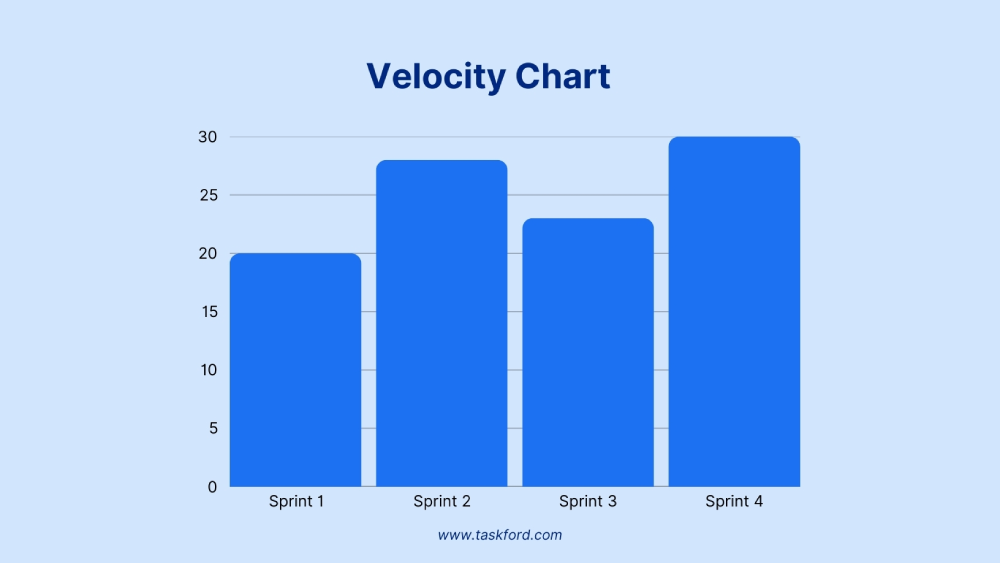
1. Velocity Chart
A Velocity Chart is one of the most common and useful visualizations in Agile. It displays the story points completed by the team in each sprint and can help you track how consistent your team’s velocity is across sprints.
How it Works:
- On the X-axis, list the sprints (e.g., Sprint 1, Sprint 2, Sprint 3).
- On the Y-axis, plot the completed story points for each sprint.
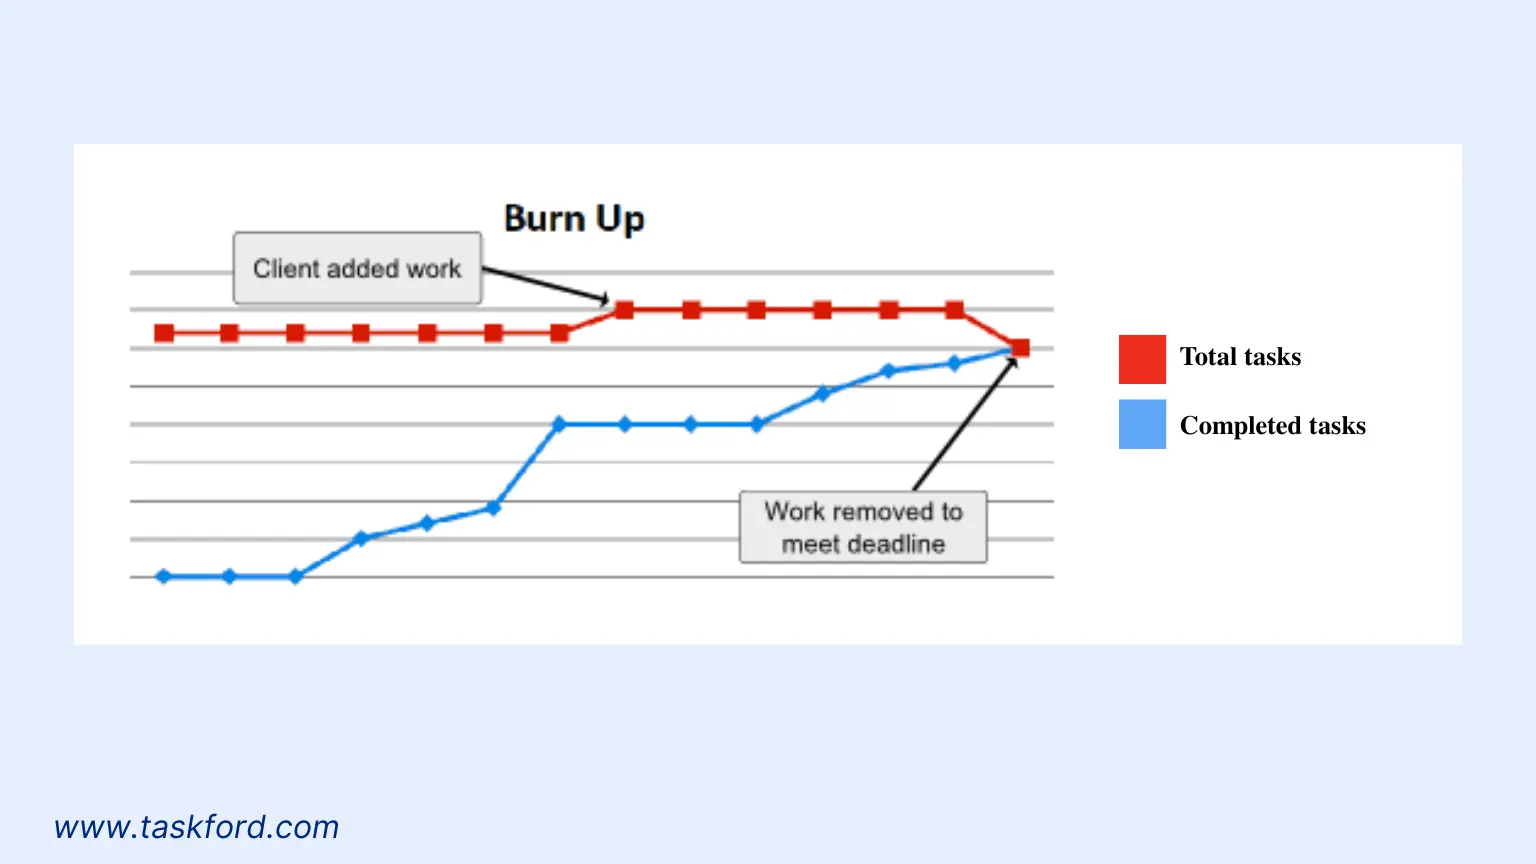
2. Burnup Chart
A Burnup Chart is another useful visualization for tracking Sprint Velocity over time, especially when planning project milestones or releases.
How it Works:
- On the X-axis, list the sprints.
- On the Y-axis, show the total work completed (story points).
- You’ll have two lines: one showing the work completed and another showing the total work remaining (if you are tracking backlog).
3. Burndown Chart
A Burndown Chart is one of the most widely used tools in Agile to track the progress of a sprint. It shows how much work remains to be done, helping teams visualize their progress toward completing the sprint goals.
How it Works:
- X-axis: Represents time (usually by days within the sprint).
- Y-axis: Represents the remaining work in story points or hours.
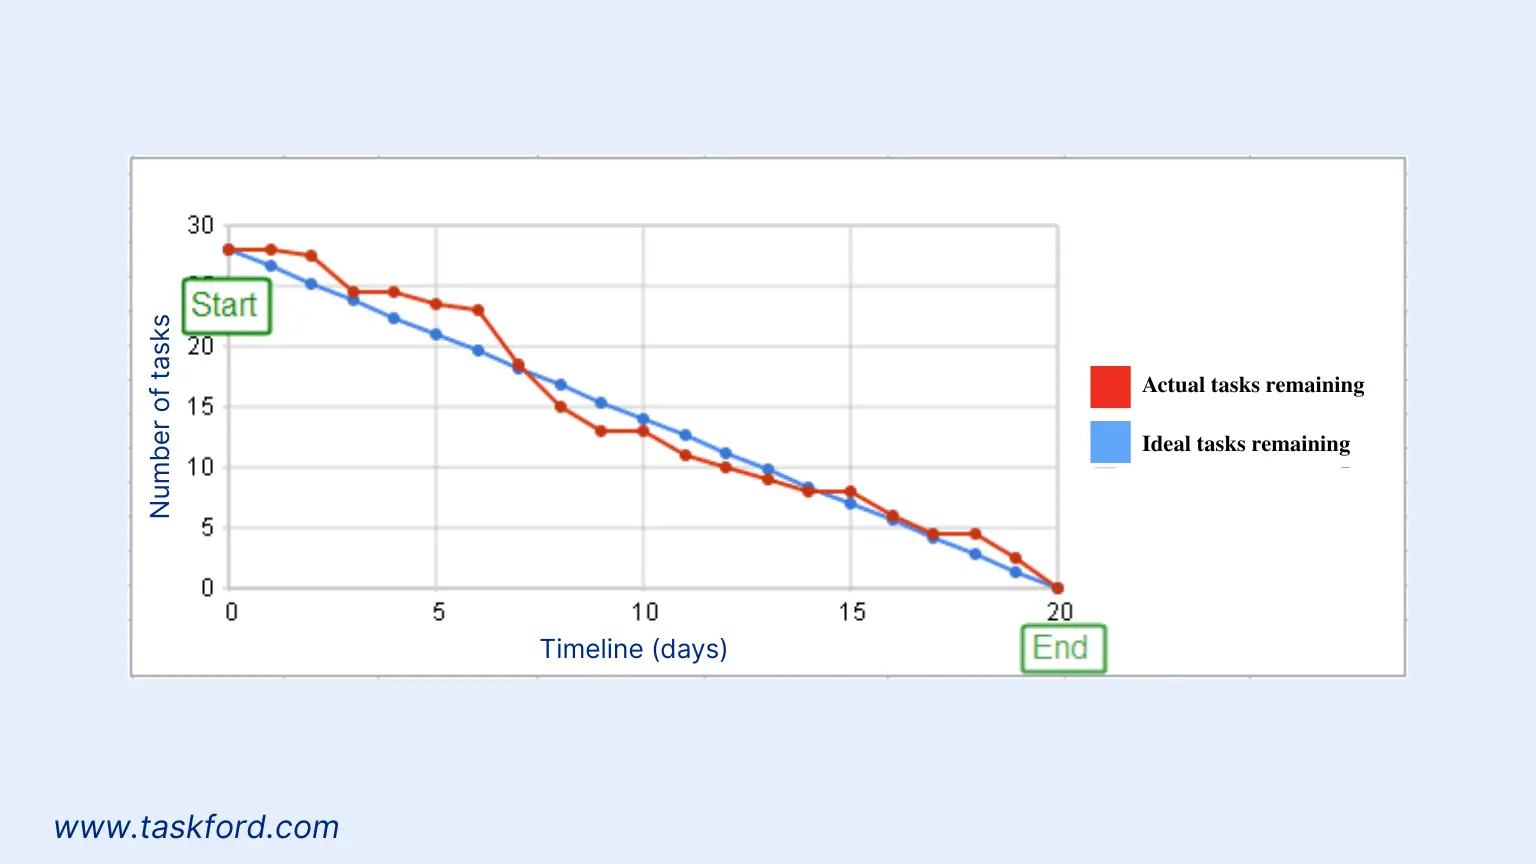
The chart starts with the total story points (or effort units) at the beginning of the sprint and “burns down” as work is completed. The goal is to see the line gradually approach zero as the sprint progresses.
Learn more about BurnUp vs BurnDown Chart: Which Agile Chart Is Right for Your Project?
Conclusion
Tracking Sprint Velocity is crucial for effective Agile planning, helping teams predict their capacity, streamline workflows, and deliver consistently. By following a reliable process — from defining estimation methods to adjusting for anomalies — you ensure that your velocity data is accurate and actionable.
When used correctly, sprint velocity aids in better forecasting, improves team performance, and keeps your projects on track without overcommitting. Ultimately, it’s about achieving predictability, sustainable pacing, and delivering value.
Continue Reading
- Triple Constraints of Project Management: Time, Scope & Cost
- Float Project Management: What Is It and How It Differs From Traditional Scheduling
- Backlog Grooming: What Is It and Why It Matters in Agile.
Subscribe for Expert Tips
Unlock expert insights and stay ahead with TaskFord. Sign up now to receive valuable tips, strategies, and updates directly in your inbox.