Dashboards That Work for Everyone (Not Just You)
Learn how to customizing role-based dashboards that works for every stakeholder, identify which metric should be included on a dashboard.
As a project manager, you’re constantly juggling multiple tasks, tight deadlines, and team members. So, how can you keep everything on track and ensure your project stays on schedule? While closely monitoring every detail might seem like the solution, with countless small tasks to oversee, is it really possible to track everything effectively?
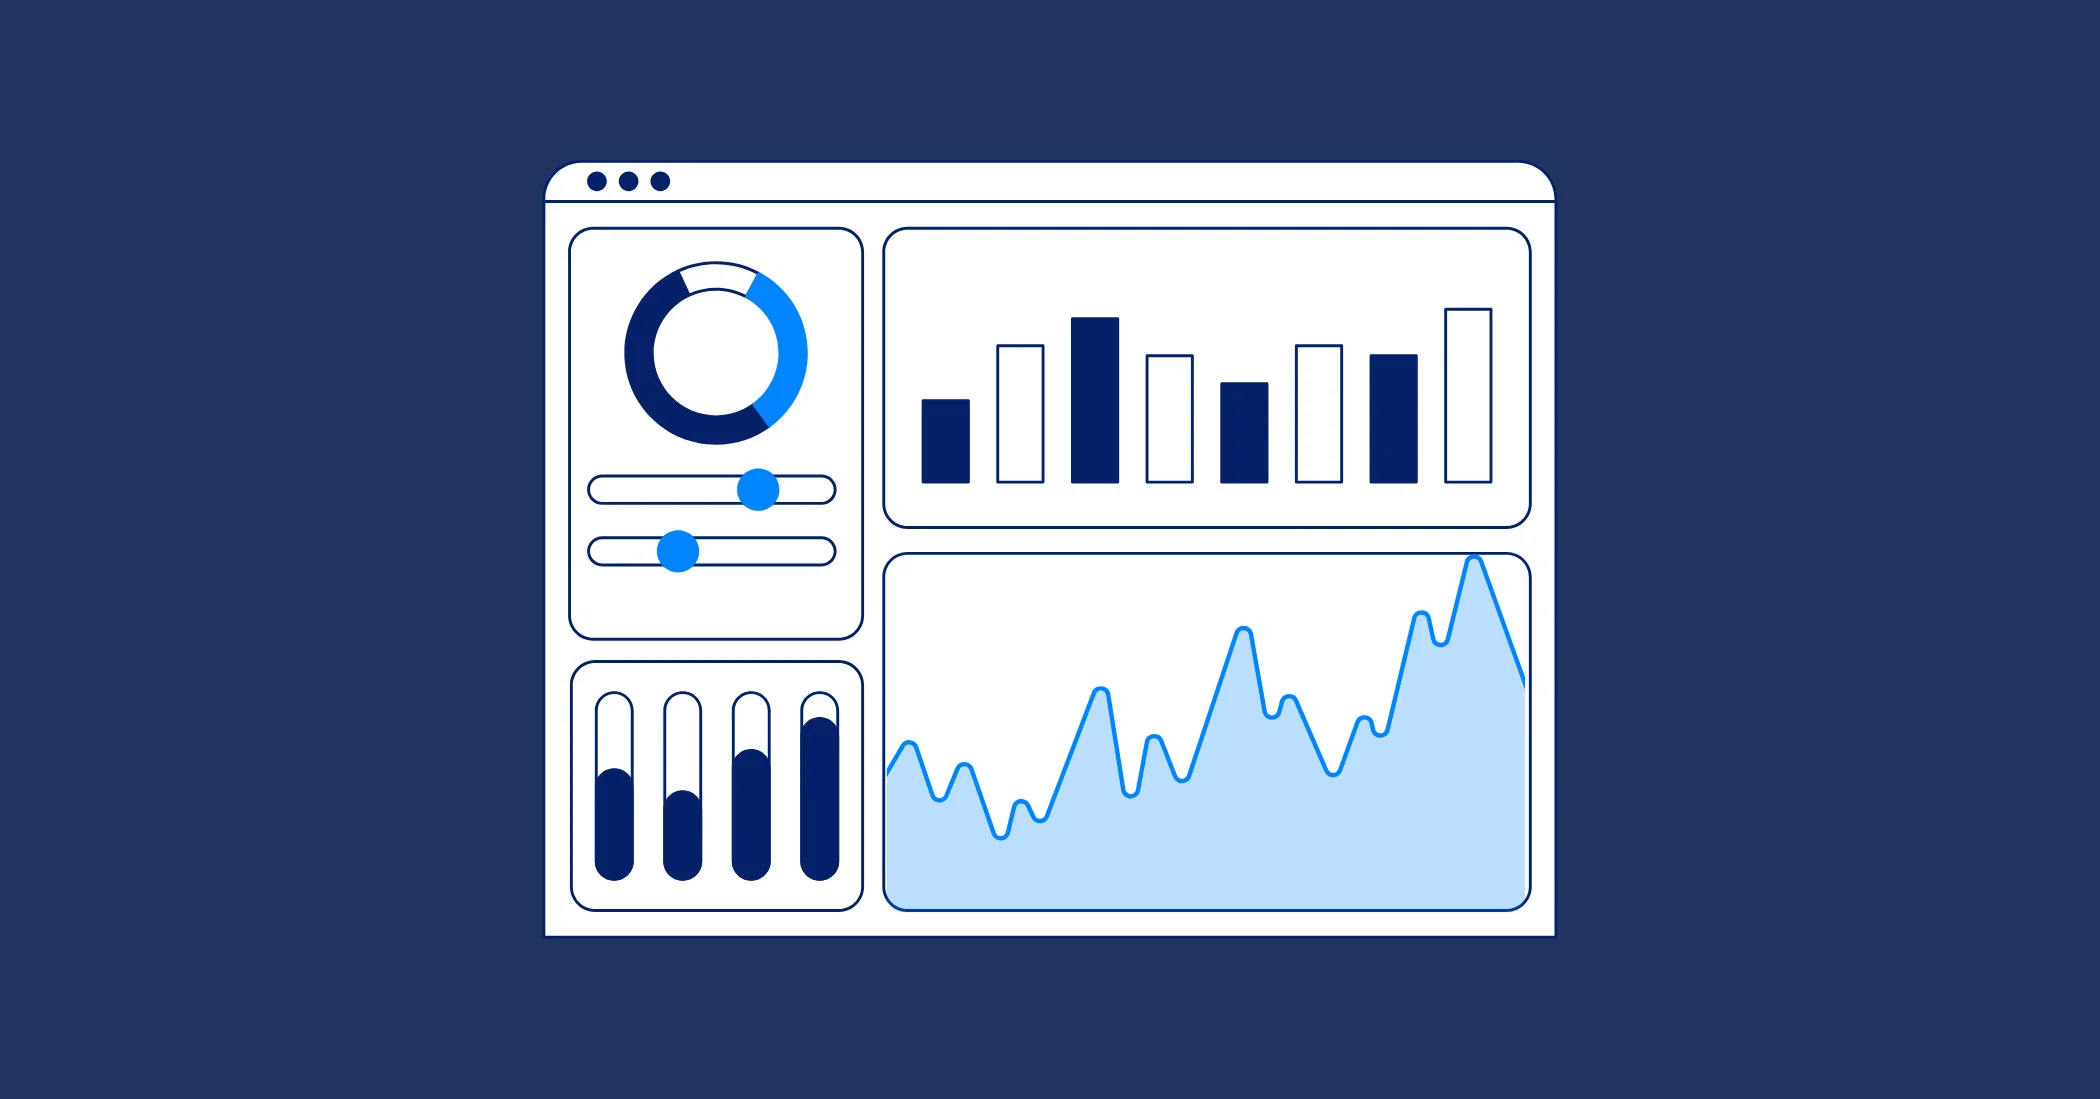
That's why you need a dashboard to bring everything together in a single view. A well-designed project dashboard consolidates all critical project information, such as task progress, resource allocation, and potential risks, giving you instant access to the data you need, without having to calculate or recheck each detail manually.
However, a good dashboard isn’t just for you, the project manager. It needs to serve all project stakeholders, from team members to executives. By customizing the dashboard for different user roles, you ensure that everyone sees the most relevant information for their responsibilities. In this article, we’ll explore the importance of creating role-based dashboards that not only streamline your project management tasks but also enhance collaboration, transparency, and overall project success.
Why Dashboards Are Essential for Project Success

Project managers and stakeholders often need to oversee multiple projects at the same time. Staying organized and keeping track of every project detail is essential for making fast, informed decisions and ensuring projects stay on schedule.
A well-designed project dashboard consolidates all critical project information into a single, centralized location. Instead of sifting through emails, spreadsheets, or multiple documents, a role-based dashboard ensures that each team member - whether a project manager, team member, or executive - has access to the most relevant data in real time.
With real-time project tracking, dashboards provide instant insights into task progress, resource allocation, and potential risks. This allows project managers to make decisions based on the current project status, rather than relying on outdated or incomplete information.
Dashboards also act as a centralized communication hub, where updates, feedback, and discussions are visible in one place. This transparency ensures that all stakeholders understand the project’s progress and challenges, fostering better collaboration and alignment across the team.
Moreover, dashboards help project managers identify risks early using visual indicators and trend analysis. By spotting potential issues before they escalate, managers can take corrective action to keep projects on track and avoid costly delays.
What is a Role-Based Dashboard That Works for Every Stakeholder
The beauty of a role-based dashboard is its flexibility. Different stakeholders require different perspectives on project data. Project managers need detailed insights into tasks and resources, team members benefit from clear views of their responsibilities, and executives require high-level overviews of project status and performance. By customizing dashboards for each role, organizations can improve decision-making, accountability, and overall project success.

1. Project Manager
The project manager is responsible for overseeing the entire project. A well-structured dashboard helps them monitor key project metrics, manage resources, and ensure deadlines are met.
Key Information Displayed:
- Task Progress: Percentage of completion for each task and milestone, using progress bars or Gantt charts.
- Resource Allocation: Visual representation of resource distribution (e.g., how many hours each team member has allocated for the week).
- Budget Tracking: Actual vs. planned budget, showing expenses incurred and remaining budget.
- Risk Indicators: A risk matrix highlighting potential risks, with severity and probability ratings.
- Team Performance: Key performance indicators (KPIs) for team members, such as task completion rate and productivity.
The dashboard for the project manager displays detailed insights into the project's current status, allowing them to drill down into specific areas like task completion or resource usage.
2. Team Members
For team members, the dashboard is designed to give them a clear view of their responsibilities and deadlines.
Key Information Displayed:
- Assigned Tasks: The tasks assigned to them, along with deadlines and progress tracking.
- Task Priorities: Visual cues that highlight the priority level of each task.
- Task Status: A visual indicator of task status (e.g., "To Do," "In Progress," "Completed").
- Time Tracking: Hours worked vs. hours estimated for each task.
- Upcoming Deadlines: A countdown or a list of upcoming deadlines for assigned tasks.
- Comments and Feedback: Any relevant feedback or comments from project managers or colleagues on specific tasks.
The dashboard for team members is user-friendly and focuses on individual tasks, deadlines, and priorities. This enables them to easily track their work without being overwhelmed by unnecessary information.
3. Executives
Executives and senior managers require a high-level overview of the project. The dashboard for executives focuses on key performance indicators (KPIs) and overall project health.
Key Information Displayed:
- Project Health: Overall project status (e.g., "On Track," "At Risk," "Delayed") with a traffic light system (green, yellow, red).
- Budget Summary: A snapshot of total project budget, total spent, and remaining budget.
- Milestone Progress: Percentage of milestones completed vs. planned, presented in a Gantt chart or milestone timeline.
- Key Performance Indicators (KPIs): High-level KPIs such as ROI, project velocity, and budget efficiency.
The executive dashboard offers an overview of critical metrics like progress, budget, and risk, helping them make strategic decisions without delving into the finer details.
4. Clients
For clients, the dashboard is often tailored to focus on the progress of deliverables and deadlines. It helps them stay informed without getting bogged down in project specifics.
Key Information Displayed:
- Delivery Milestones: A list of key deliverables, their deadlines, and current completion status (e.g., "On Schedule," "Delayed").
- Quality Metrics: Metrics on the quality of deliverables, such as defect counts, testing results, or customer satisfaction scores.
- Progress Updates: A summary of overall project progress, with key milestones completed.
- Issues and Risks: Overview of any critical issues or risks impacting deliverables.
- Project Timeline: A visual timeline of the project with key dates for client deliverables.
The dashboard for clients is straightforward, focusing on the project’s overall progress and final deliverables, with the ability to view updates and timelines.
5. Resource Managers
Resource managers need a dashboard that provides a clear view of resource usage and availability throughout the project lifecycle.
Key Information Displayed:
- Resource Allocation: Percentage of each resource (personnel, equipment) allocated to tasks in the project, using pie charts or bar graphs.
- Resource Utilization Rate: A measure of how efficiently resources are being used, calculated as the ratio of work done vs. available hours.
- Resource Availability: Availability of resources (team members or equipment), showing when they are free or overbooked.
- Resource Utilization Forecast: Projected usage of resources for upcoming weeks, highlighting potential overutilization.
- Workload Balancing: A visual display of workload distribution to ensure no resources are overloaded or underutilized.
The dashboard for resource managers highlights resource allocation and usage, enabling them to optimize the project’s resource management.
How to Customize Dashboards That Work for Everyone

Customizing a dashboard to suit the needs of all stakeholders requires designing it based on the specific needs and responsibilities of each user group. Below is how to customize a project dashboard for different stakeholders:
1. Identify Stakeholders and Their Needs
Each stakeholder has a different perspective on the project and distinct requirements for the information they need to view. To design a dashboard that meets their needs, you must survey, analyze, and fully understand their requirements. This can be done by referring to past project experiences or through direct consultations, such as asking specific questions to gather insights. By understanding these needs, you can create a dashboard that provides relevant data tailored to each stakeholder's role.
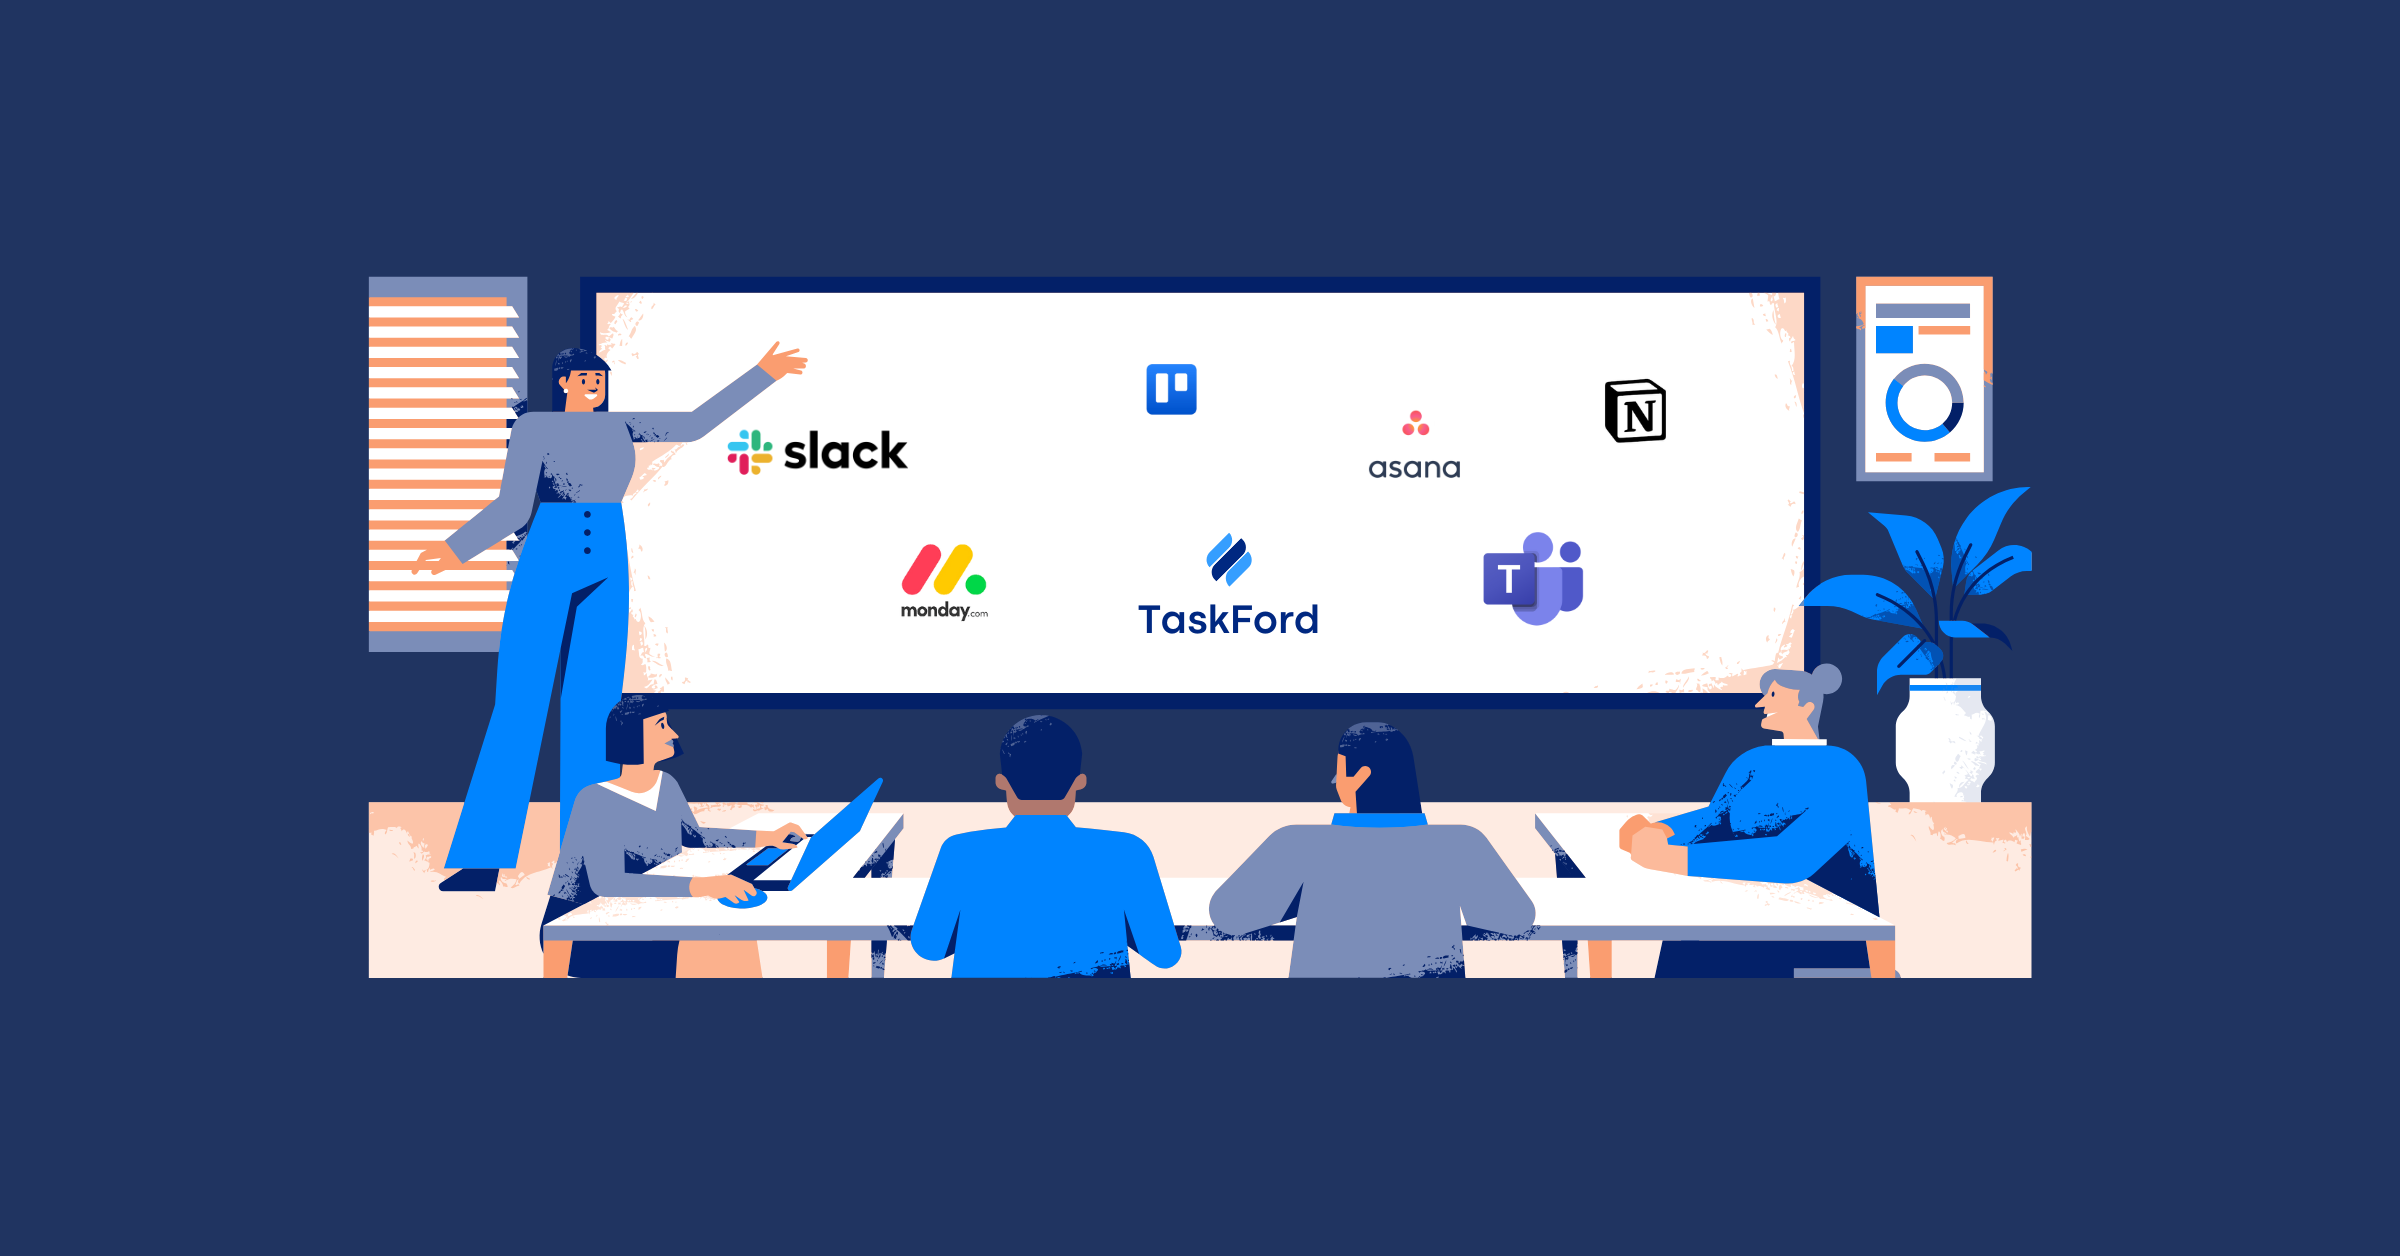
2. Choose the Right Project Management Tool
Although each stakeholder may require a different view of the dashboard, this doesn’t mean you need to create separate dashboards for everyone. It's important to keep all the information in one place, within a single tool, to streamline project tracking and management. Having a centralized dashboard saves time, increases transparency, and reduces the chances of losing or missing critical information.
Most project management tools today offer built-in dashboard functionalities, but the approach to customization and features can vary. When choosing the right tool, consider the following features:
- Customizable Dashboards: Choose a tool that allows you to drag and drop widgets to create customized dashboards for each stakeholder.
- Custom Fields: The tool should allow you to set up custom fields for specific data that stakeholders need to see.
- Collaboration Features: Ensure the tool supports collaboration features such as comments, discussions, or sharing, which enhances communication among stakeholders.
- Dashboard Sharing and Storage: The tool should allow you to save and share dashboards easily, so stakeholders can access the most up-to-date data whenever needed.
3. Create and Update Dashboards Regularly
Once you've identified the needs of each group and selected the appropriate tool, the next step is to create the dashboards with the relevant data for each stakeholder. The dashboard should be updated regularly and be easy to access, ensuring that users always have the latest information at their fingertips. Make sure the chosen tool can either automatically update data or allow easy input of new data to keep the dashboard current.
4. Review and Adjust After Each Phase
Finally, to ensure the dashboard continues to meet stakeholder needs, regularly collect feedback and review its effectiveness. After each project phase or project completion, assess the strengths and weaknesses of the dashboard. This evaluation will help identify areas for improvement, enabling you to refine the dashboard for future use, ensuring it continues to be effective and user-friendly.
Conclusion
In conclusion, dashboards play a pivotal role in effective project management by consolidating key project information and providing real-time insights into progress, resources, risks, and budgets. Customizing dashboards for different stakeholders, such as project managers, team members, executives, clients, and resource managers, ensures that everyone has access to the most relevant data for their roles, enhancing collaboration, transparency, and decision-making. A well-designed dashboard not only streamlines project tracking but also helps identify issues early, fosters better communication, and ultimately contributes to project success. By leveraging role-based dashboards, organizations can optimize project management and align all stakeholders toward achieving common goals efficiently.

Making work simpler,
smarter, and more connected
Join our waitlist and be notified first.

Related Blog

Subscribe for Expert Tips
Unlock expert insights and stay ahead with TaskFord. Sign up now to receive valuable tips, strategies, and updates directly in your inbox.