The Capacity Planning Metrics Every Team Should Track
Discover the essential capacity planning metrics your team needs to optimize resource management and achieve project success.
Effective team capacity planning is the backbone of successful project delivery. It ensures your team has the right resources, skills, and time to meet demands without overworking or underutilizing anyone. By tracking the right capacity planning metrics, you gain clear insights into resource management, helping you avoid burnout, missed deadlines, or wasted potential.
This blog explores the essential metrics every team should monitor to optimize their capacity planning and achieve consistent results. Let’s dive into why these metrics matter and how to use them effectively.
What Is Capacity Planning?
Capacity planning is the process of assessing and aligning your team’s resources—people, skills, and time—with project demands. It involves forecasting workloads, evaluating team availability, and ensuring you have the right capabilities to meet goals. Done well, it balances demand and supply, keeping projects on track while maintaining team morale.
For a deeper dive into the fundamentals, check out our detailed guide on What Is Capacity Planning.
Why Capacity Planning Metrics Are Critical
Metrics provide measurable insights into your team’s performance and resource allocation. They help you:
- Spot bottlenecks early to keep projects on track.
- Allocate resources efficiently for maximum productivity.
- Forecast future needs with greater accuracy.
- Boost team morale by preventing overwork.
- Align efforts with broader business objectives.
Without metrics, you’re guessing. Tracking the right data empowers you to make informed choices and optimize team capacity planning. Below are the key metrics to focus on.
Key Metrics for Effective Team Capacity Planning
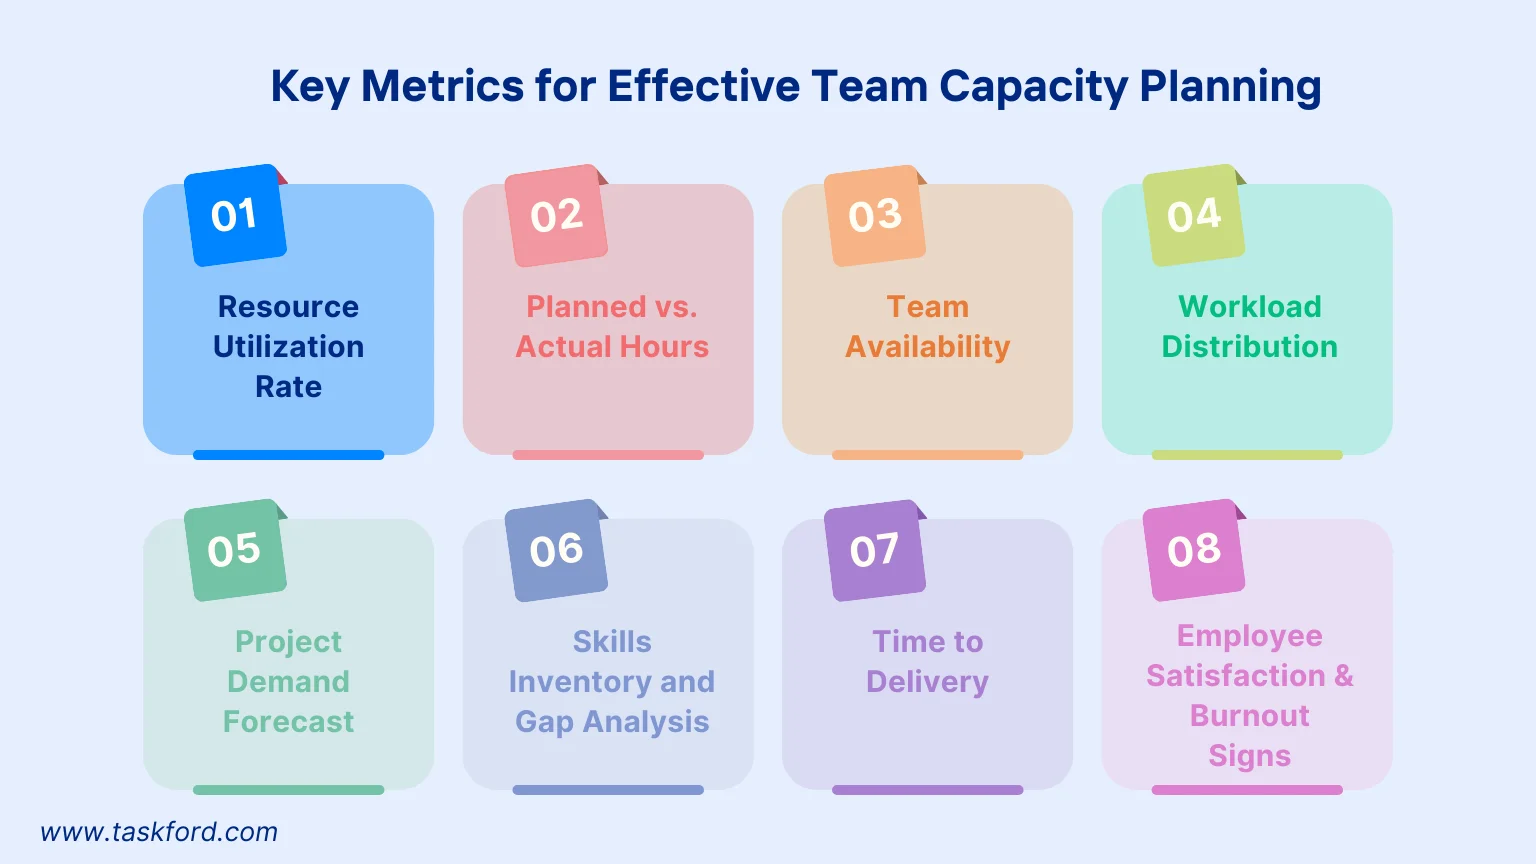
1. Resource Utilization Rate
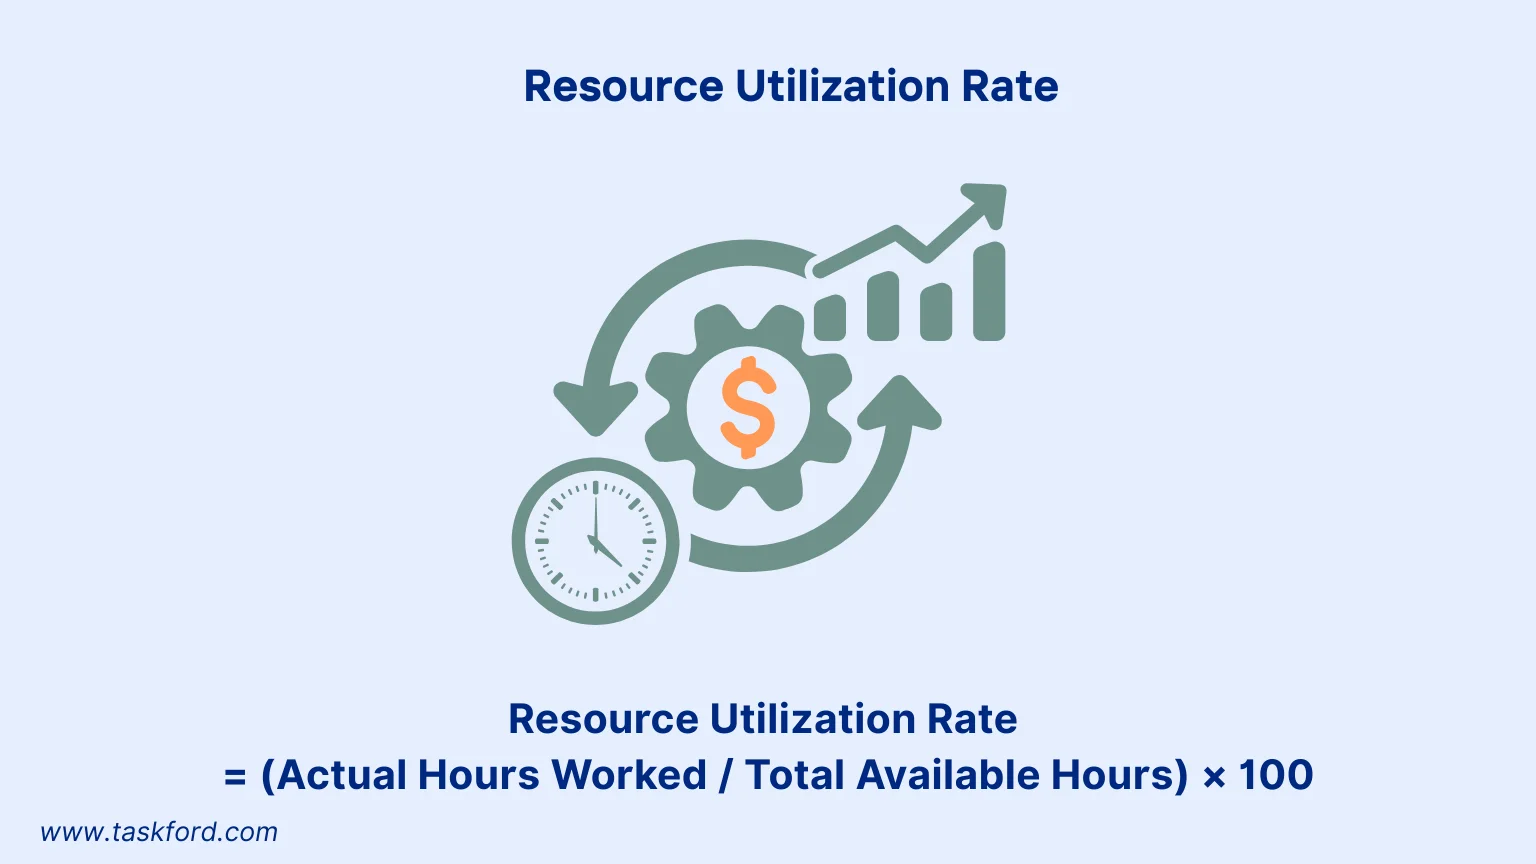
What It Measures
The resource utilization rate shows how effectively your team uses their available time for productive tasks. It’s calculated as a percentage by dividing actual hours worked on projects by total available hours.
Formula:
Resource Utilization Rate = (Actual Hours Worked / Total Available Hours) × 100
For example, if a team member has 40 hours available weekly but spends 32 hours on project tasks, their utilization rate is 80%.
Why It Matters
A high rate (near 100%) may signal overwork, risking burnout. A low rate suggests underutilization, meaning resources could be better allocated. This metric helps you balance workloads and optimize resource management.
How to Use It
Track utilization weekly using tools like TaskFord or Toggl Track. With these tools, you can track the time that employees have worked and then calculate the rates. If rates are consistently high or low, adjust task assignments or reallocate resources to ensure efficiency without overloading anyone.
2. Planned vs. Actual Hours
What It Measures
This metric compares the estimated hours for a task or project (planned hours) with the actual time spent. The difference highlights planning accuracy and potential inefficiencies.
How to Track It
Use project management tools to log planned hours during the planning phase and track actual hours upon completion. Calculate the variance: Actual Hours - Planned Hours.
Why It Matters
If actual hours regularly exceed planned hours, you may be underestimating task complexity or facing scope creep. If actual hours are lower, you might be overestimating, leaving capacity unused. This metric refines future estimates and strengthens capacity planning.
Example
A project planned for 100 hours takes 120 hours, indicating a 20-hour overrun. Use this data to improve estimates or allocate more resources for similar projects.
3. Team Availability
What It Measures
Team availability tracks the total time your team has for project work, factoring in non-project activities like vacations, training, or meetings.
How to Track It
Subtract non-project time (e.g., 10 hours for meetings) from total working hours (e.g., 40 hours per team member). For a five-member team, if each loses 10 hours, total availability is 150 hours weekly (5 × 30 hours).
Why It Matters
Knowing true availability prevents overcommitting your team. It also informs hiring or outsourcing decisions when capacity is limited. Use this metric to plan realistic project schedules.
Tip: Regularly update availability data to account for holidays or unexpected absences, ensuring accurate capacity forecasts.
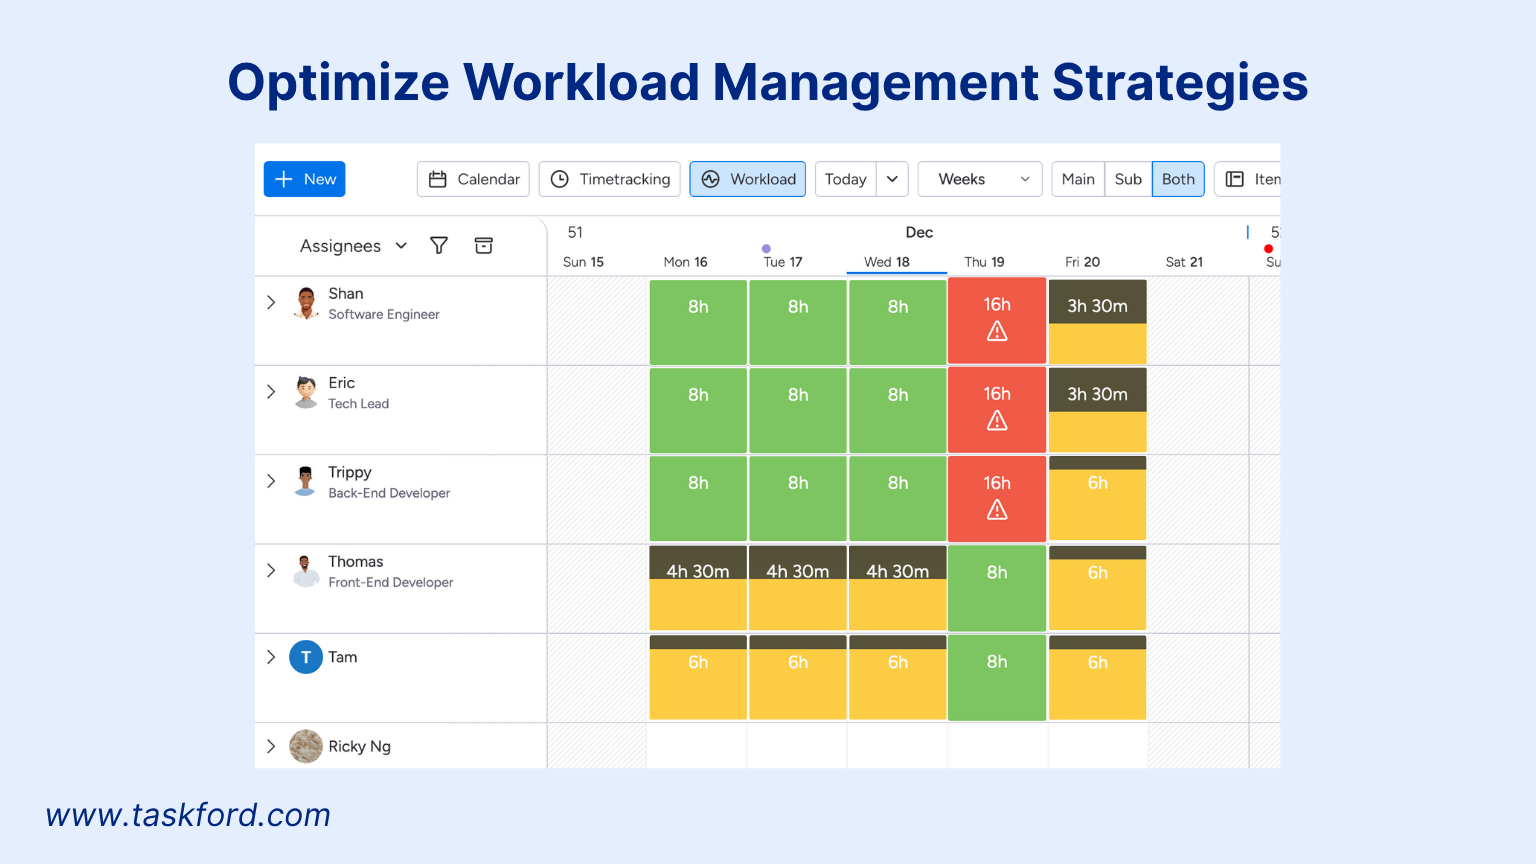
4. Workload Distribution
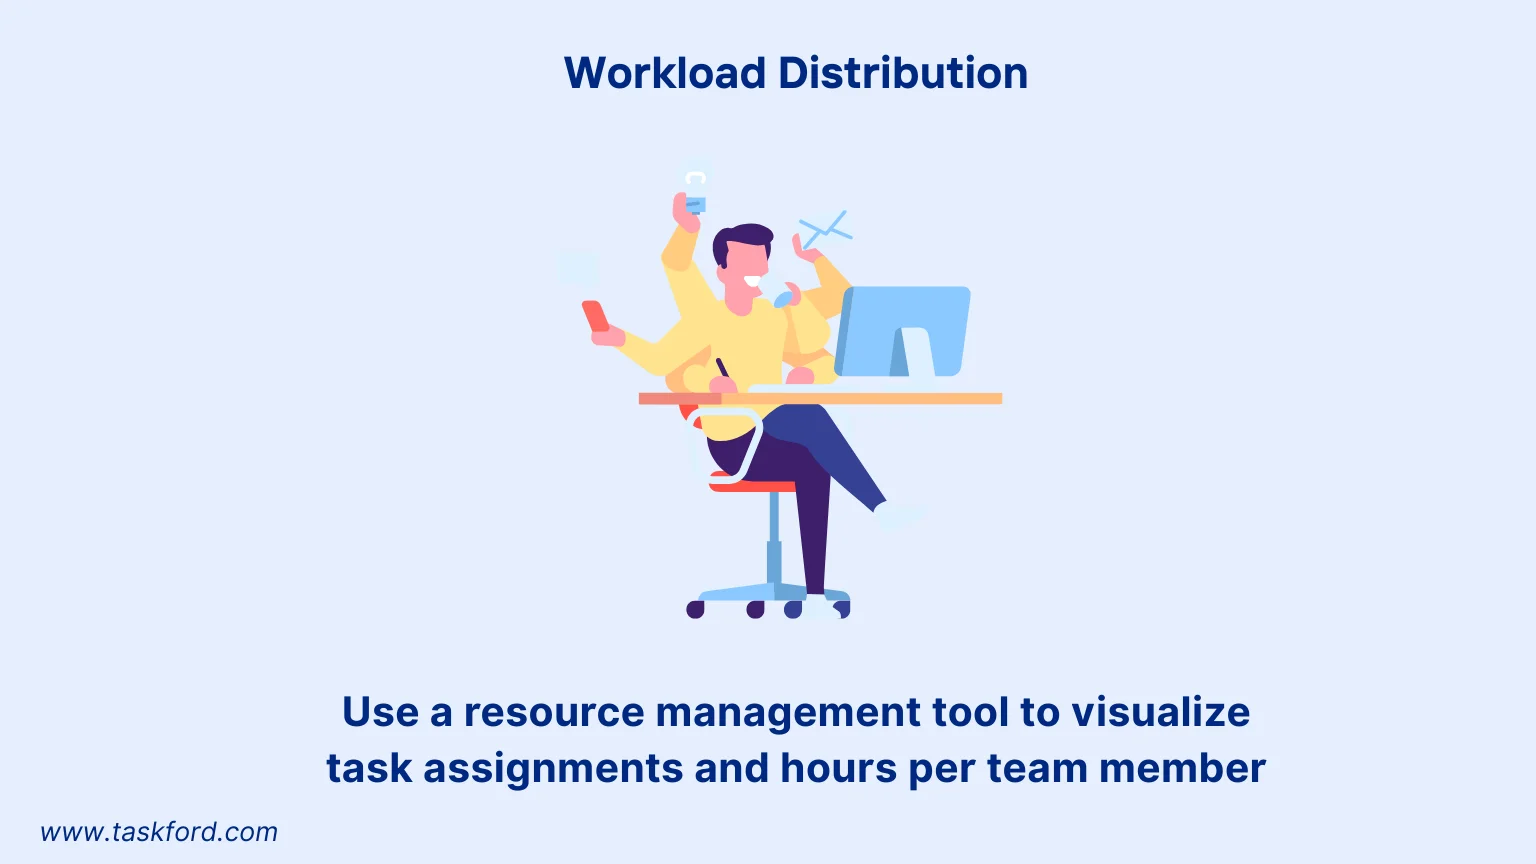
What It Measures
Workload distribution examines how tasks are assigned across team members, revealing imbalances in workload allocation.
How to Track It
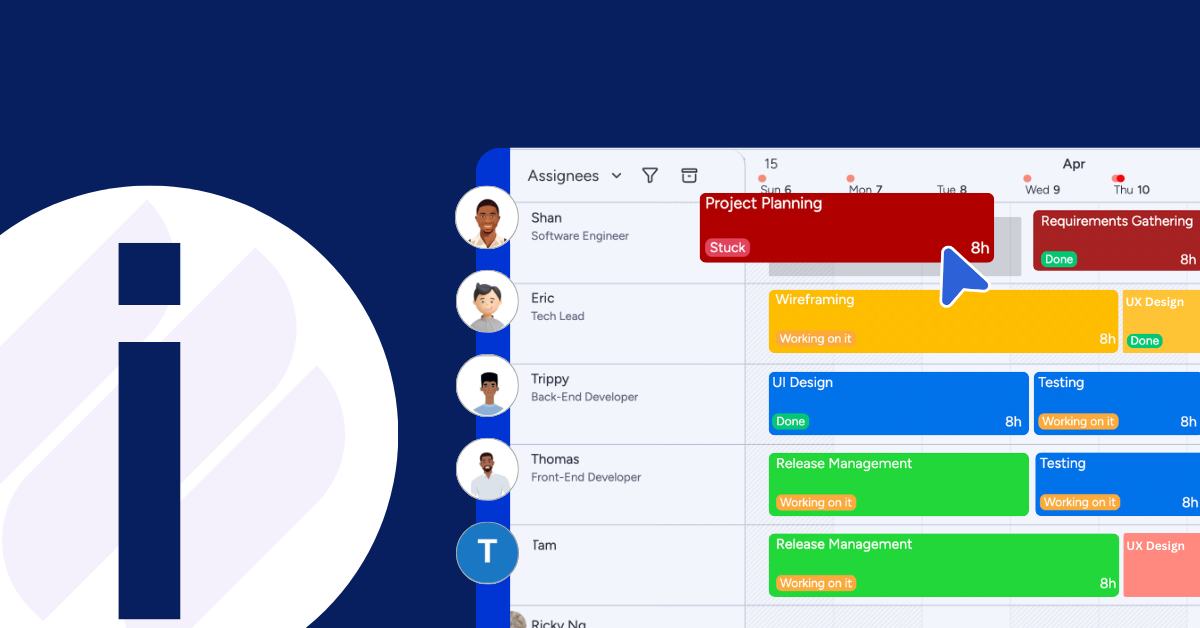
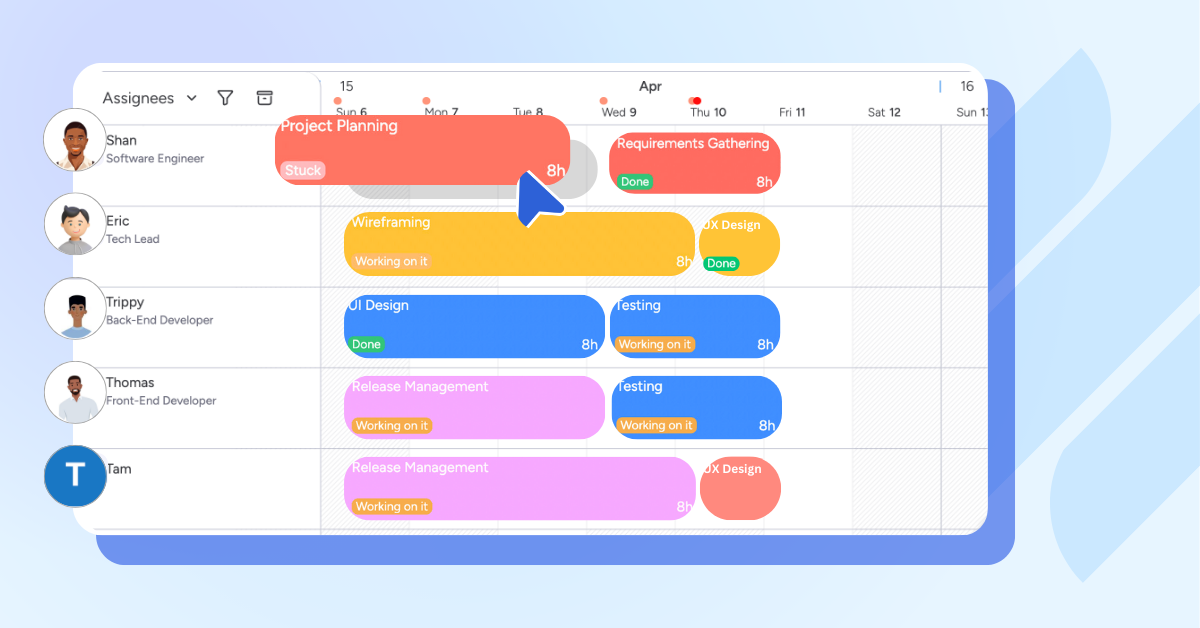
Use resource planning tools to visualize task assignments and hours per team member. Look for signs of uneven distribution, like one person handling 60% of a project’s tasks.
Why It Matters
Balanced workloads boost morale and productivity. Uneven distribution can create bottlenecks or leave some team members idle. This metric ensures fair task allocation and efficient resource use.
Best Practice
Combine this metric with skills inventory (below) to assign tasks based on expertise, not just availability, for better outcomes.
5. Project Demand Forecast
What It Measures
Project demand forecasting predicts the resources and time needed for future projects based on historical data and current trends.
How to Track It
Analyze past project data to identify patterns, such as a marketing campaign requiring 200 design hours. Combine with input from sales or client teams to anticipate demand spikes.
Why It Matters
Accurate forecasts prevent resource shortages or overstaffing. They also aid budgeting, hiring, and scheduling. For example, a predicted 30% demand increase next quarter signals the need for additional staff or training.
Pro Tip
Use scenario planning to prepare for best-case and worst-case demand scenarios, keeping your team agile.
6. Skills Inventory and Gap Analysis
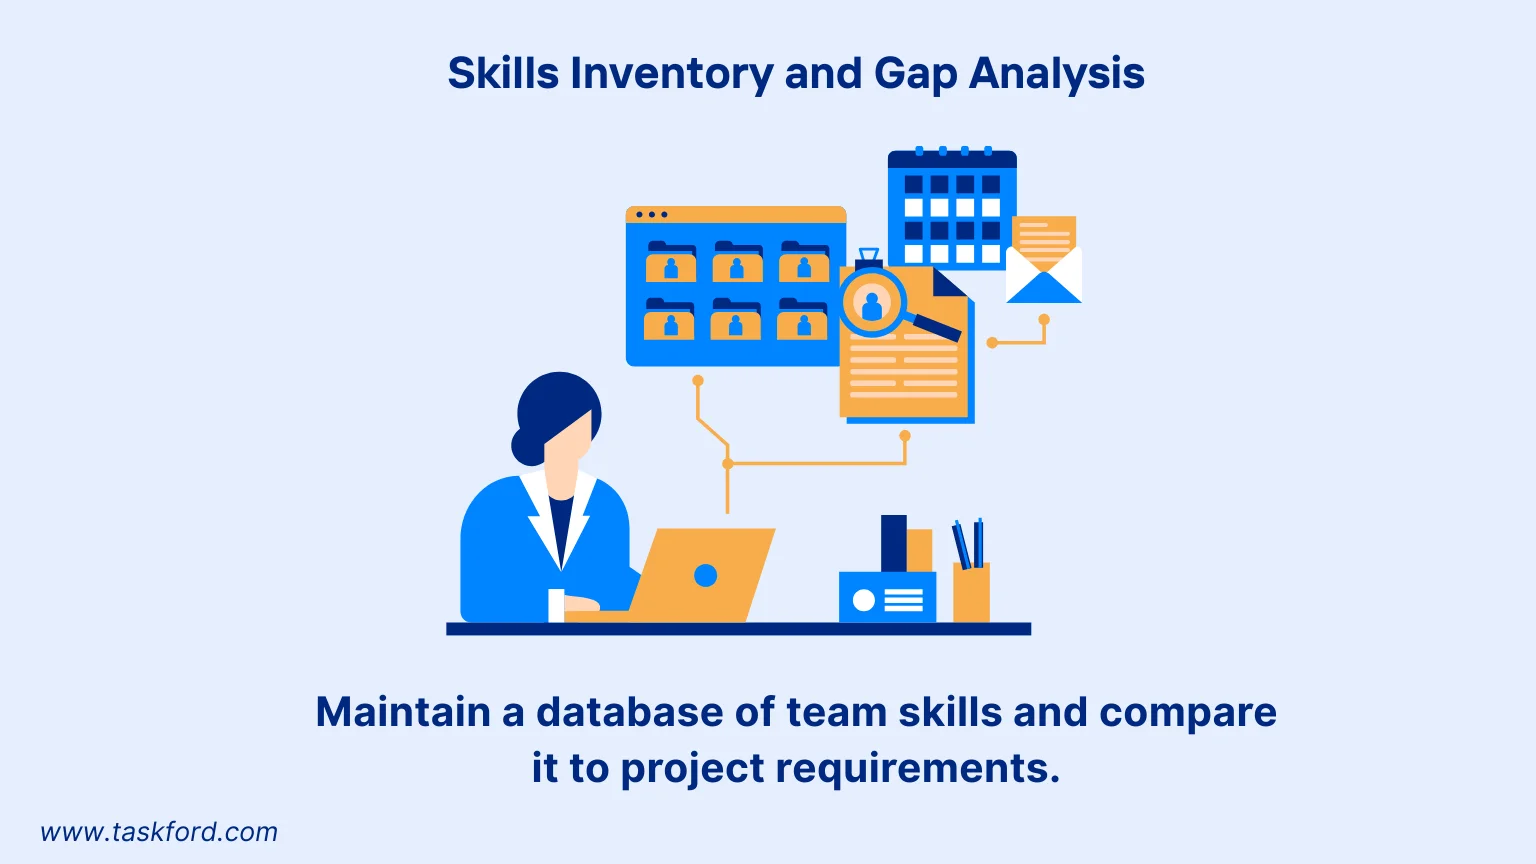
What It Measures
A skills inventory catalogs your team’s expertise, certifications, and experience. Gap analysis identifies missing skills needed for upcoming projects.
How to Track It
Maintain a database of team skills and compare it to project requirements. For instance, if a project needs cloud architecture expertise but no one has it, you’ve found a gap.
Why It Matters
This metric ensures tasks are assigned to the right people and highlights training or hiring needs. It supports long-term resource management by aligning skill development with business goals.
Example
A software team lacks data analysis skills for a new project. Gap analysis prompts hiring a specialist or investing in training, ensuring capacity meets demand.
7. Time to Delivery
What It Measures
Time to delivery compares actual project completion time to the planned timeline, reflecting efficiency and deadline adherence.
How to Track It
Record project start and end dates, then compare them to the planned schedule. Calculate delays or early completions as a percentage of the planned timeline.
Why It Matters
Frequent delays signal capacity issues, like insufficient resources or poor planning. Early completions may indicate overcapacity or conservative estimates. This metric helps fine-tune capacity planning.
Example
A project planned for 30 days finishes in 35, indicating a need to adjust resource allocation or timelines for similar projects.
8. Employee Satisfaction and Burnout Indicators
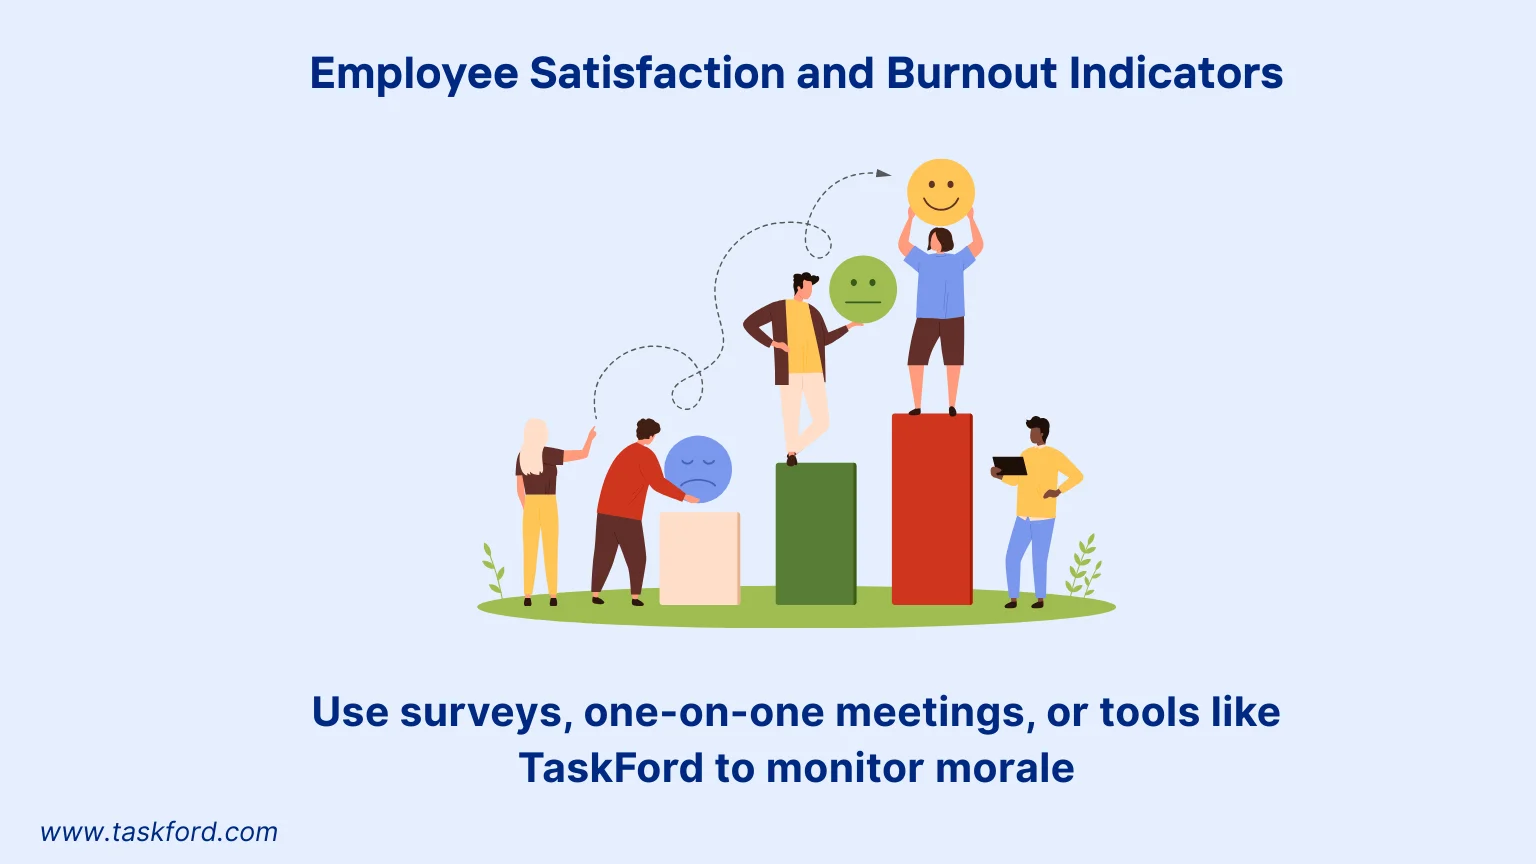
What It Measures
Employee satisfaction tracks team morale and workload sustainability, using indicators like overtime hours, absenteeism, or survey feedback.
How to Track It
Use surveys, one-on-one meetings, or tools like TaskFord to monitor morale. High overtime (e.g., 20% of total hours) or frequent absences may signal burnout risk.
Why It Matters
Satisfied employees are more productive and reliable, directly impacting capacity. Monitoring this metric helps maintain a sustainable pace and prevents turnover.
Best Practice
Act on feedback quickly, such as redistributing tasks or offering support, to keep your team engaged and productive.
(Learn more: How To Reduce Burnout On A Project)
Steps to Make Capacity Planning Metrics Actionable
Tracking metrics is just the start. Here’s how to use them effectively:
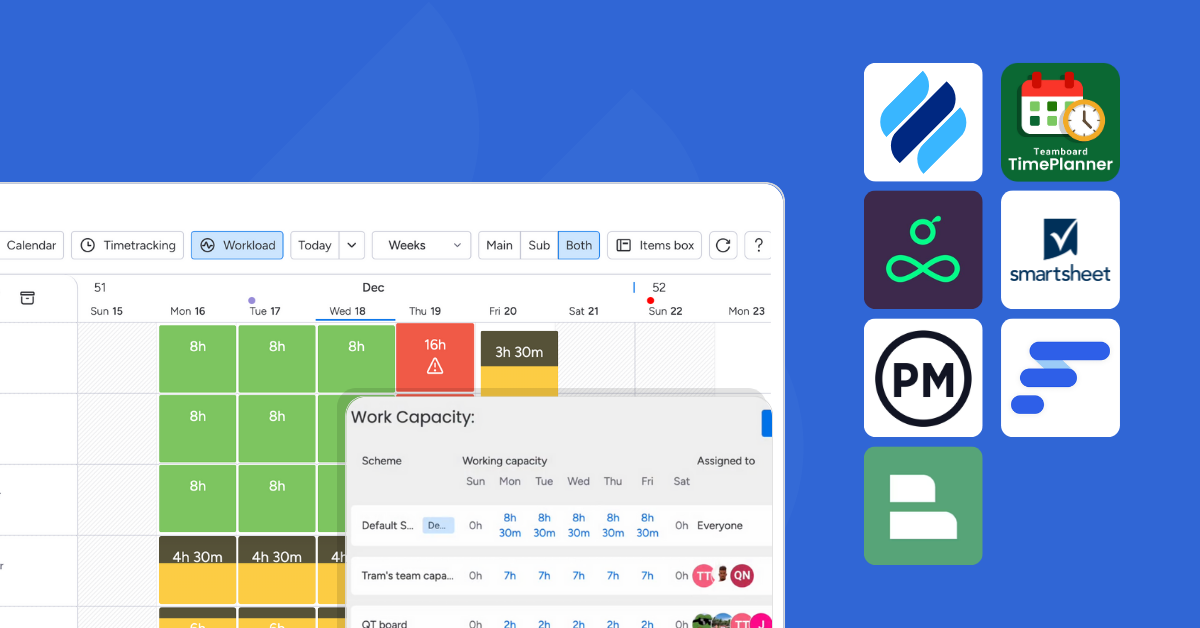
- Leverage Tools: TaskFord, a comprehensive project management and resource planning platform, can be used to track and view time data, availability, and workloads, enhancing capacity planning experience.
- Set Benchmarks: Establish baselines from past performance to measure progress.
- Review Regularly: Check metrics weekly or monthly to catch issues early.
- Engage the Team: Share insights to foster transparency and collaboration.
- Adapt Dynamically: Reallocate resources or adjust timelines based on metric trends.
Overcoming Common Challenges in Capacity Planning
Team capacity planning can face hurdles that disrupt efficiency. Below are three common challenges, data accuracy, team resistance, and unpredictable demand, with practical solutions to ensure effective resource management.
1. Inaccurate Data
The Challenge:
Inconsistent data, such as unreliable time tracking or outdated skills records, can distort metrics. For example, incorrect hour logs may inflate resource utilization rates, leading to misinformed task assignments.
The Solution:
Standardize data collection using tools like TaskFord for consistent time tracking. Update skills inventories every quarter to reflect current expertise. Train teams to prioritize accurate data entry.
Practical Steps:
- Set automated reminders for time logging.
- Audit data monthly to ensure accuracy.
- Use dashboards to quickly identify errors.
Reliable data is the backbone of effective capacity planning.
2. Team Resistance
The Challenge:
New tools or processes may face pushback from team members who see them as extra work. For instance, a developer might resist a new resource management platform, slowing adoption.
The Solution:
Highlight benefits like balanced workloads and reduced stress. Involve the team in selecting tools and provide short training sessions. For example, show how TaskFord simplifies task tracking to gain buy-in.
Practical Steps:
- Share the purpose in a quick team meeting.
- Offer 15-minute training on new tools.
- Recognize early adopters to boost engagement.
Team involvement minimizes resistance and supports collaboration.
3. Unpredictable Demand
The Challenge:
Sudden project changes, like a client’s urgent deadline, can strain resources. A 10% demand spike could overwork your team if not anticipated.
The Solution:
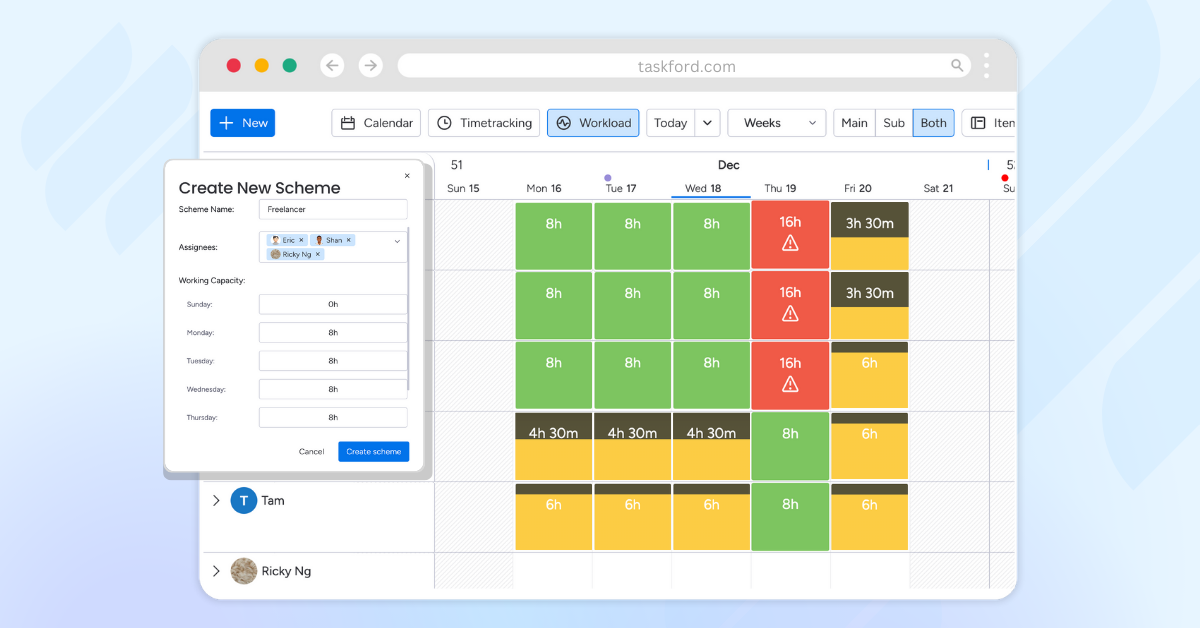
Use forecasting and scenario planning for flexibility. Review past projects for demand trends and maintain a freelancer list for surges. Tools like TaskFord can help you track past data so you can assess capacity needs.
Practical Steps:
- Update forecasts monthly with client insights.
- Reserve a 10% time buffer for unexpected tasks.
- Define clear task prioritization guidelines.
Planning for uncertainty keeps your team prepared and agile.
Conclusion
Mastering team capacity planning requires tracking the right metrics to optimize resource management and deliver projects successfully. By monitoring resource utilization, team availability, workload distribution and more, you gain the clarity needed to make smart decisions. These metrics help balance workloads, improve efficiency, and keep your team motivated.
With these metrics in your toolkit, your team can achieve better resource management, hit deadlines, and maintain a healthy, productive work environment. Start today with TaskFord and unlock your team’s full potential.
Learn more
- Agile Capacity Planning: How to Match Team Velocity with Real-World Workloads
- How Workforce Capacity Planning Helps You Say “Yes” to the Right Work
- Crafting a Resource Management Plan: A Project Manager's Handbook

Making work simpler,
smarter, and more connected
Join our waitlist and be notified first.


![What is an Effective Resource Management Plan Template [Free Download]](https://taskford.com/marketing/blog/resource-management-plan-template.webp)


Subscribe for Expert Tips
Unlock expert insights and stay ahead with TaskFord. Sign up now to receive valuable tips, strategies, and updates directly in your inbox.