How an Agile Gantt Chart Helps Scrum Teams Manage Projects
Learn how an agile Gantt chart boosts Scrum team efficiency with better sprint planning, dependency tracking, and stakeholder clarity. Tips included!
Scrum teams excel at delivering value fast through flexible, iterative sprints—but what happens when you need a clear timeline without losing that agility? Traditional Gantt charts feel too stiff, while Scrum boards alone can leave stakeholders in the dark. Enter the Agile Gantt chart: a hybrid tool that blends Agile adaptability with visual clarity. How can it transform your Scrum projects? This blog reveals practical ways an agile Gantt chart keeps your team organized and on track—without chaining you to a rigid plan. Curious about Gantt basics? Start with What is a Gantt Chart.
What is an Agile Gantt Chart?
An agile Gantt chart is a modified version of the traditional Gantt chart, reimagined for Agile workflows like Scrum. While a standard Gantt chart maps out every task in a project with fixed start and end dates, an agile Gantt chart focuses on shorter timeframes—like sprints—and embraces change. It uses horizontal bars to show task durations and dependencies, but it’s built to evolve as priorities shift.
Key differences from traditional Gantt charts include:
- Shorter horizons: Focused on sprints rather than months-long timelines.
- Flexibility: Easy to adjust when feedback or new requirements emerge.
- Simplicity: High-level view instead of exhaustive detail.
For Scrum teams, an agile Gantt chart aligns with core principles: it supports iterative progress, respects adaptability, and enhances visibility across sprints. New to Gantt charts? Check out Gantt Chart 101: Definition, Key Features, and How to Use It for Project Management
Why Scrum Teams Need an Agile Gantt Chart
Challenges Scrum Teams Face
Scrum is great for iterative development, but it’s not without challenges. Teams often struggle with:
- Limited Long-Term Visibility: With eyes fixed on the current sprint, teams can lose sight of the broader project timeline. Are we on track for the final deliverable? It’s tough to tell without a bigger-picture view.
- Managing Task Dependencies Across Sprints: Tasks don’t always stay neatly within sprint boundaries. When "Database Design" in Sprint 1 delays "Feature Testing" in Sprint 2, spotting these overlaps becomes a guessing game without clear tracking.
- Stakeholder Communication Gaps: Sprint backlogs and burndown charts make sense to Agile insiders, but external stakeholders—like clients or executives—often find them cryptic. They want a simple, digestible update, not a deep dive into Scrum lingo.
How an Agile Gantt Chart Supports Scrum Teams
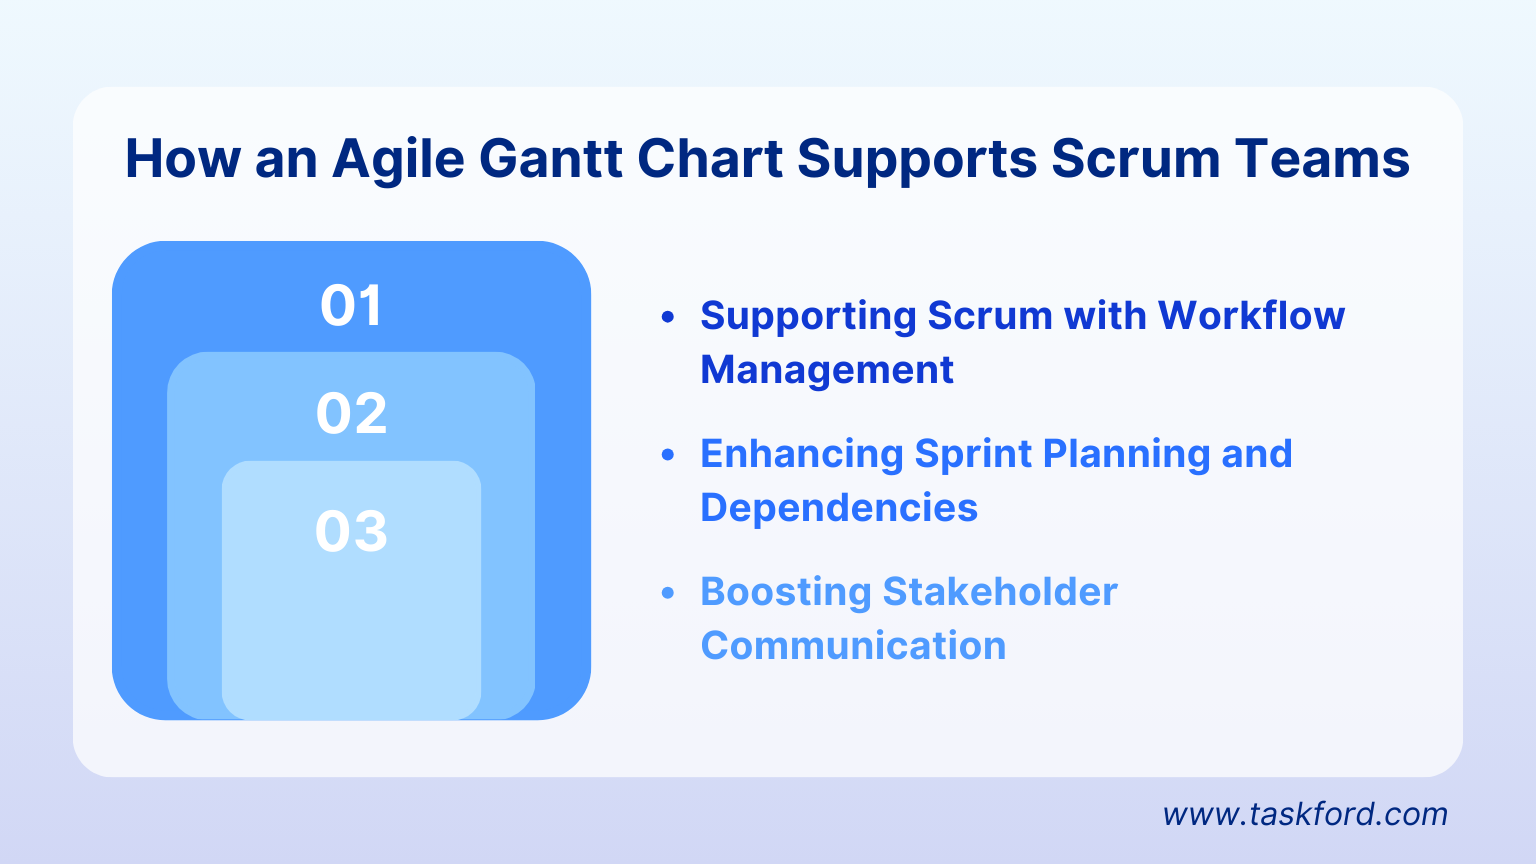
1. Supporting Scrum with Workflow Management
An agile Gantt chart offers workload insights at a glance. By mapping tasks across sprints, Scrum teams can spot overburdened team members and rebalance resources. Imagine a sprint where one developer is assigned three complex tasks while others are idle—an agile Gantt chart flags this imbalance early, keeping the team on track.
2. Enhancing Sprint Planning and Dependencies
Planning sprints is smoother with an agile Gantt chart. It visualizes how tasks fit into a sprint timeline—say, a two-week window—and shows dependencies between them. For instance, if "Backend Setup" must finish before "API Testing" can start, the chart highlights this link, preventing blockers before they derail progress.
3. Boosting Stakeholder Communication
Stakeholders unfamiliar with Scrum boards often crave a straightforward roadmap. An agile Gantt chart delivers just that, translating sprint goals into a visual timeline. It bridges the gap between technical teams and management, ensuring everyone—from product owners to executives—understands the project’s direction.
How to Create and Use an Agile Gantt Chart for Scrum
Ready to put an agile Gantt chart into action? Follow these steps to create one tailored for your Scrum team:
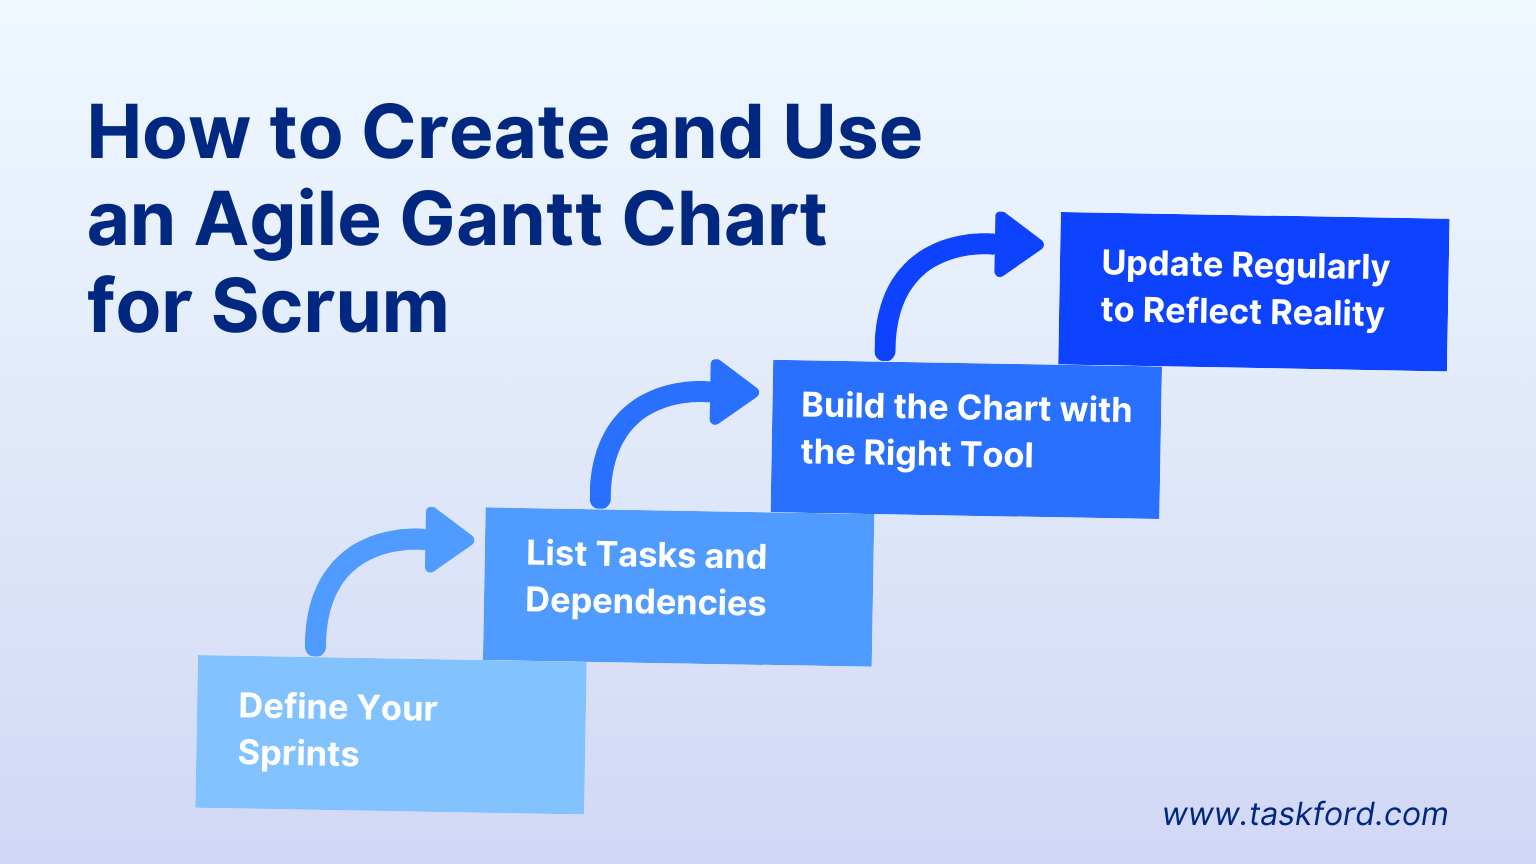
Steps to Create an Agile Gantt Chart for Scrum
Ready to streamline your Scrum projects with an agile Gantt chart? These steps will help you build and maintain one that fits your team’s unique rhythm.
1. Define Your Sprints
Start by breaking your project into manageable sprint-sized chunks, typically lasting 1-4 weeks depending on your team’s rhythm. For example, if you’re launching a website, you might map out "Sprint 1: Wireframes" (2 weeks) and "Sprint 2: Frontend Coding" (2 weeks). This sets the foundation for your chart, giving each sprint a clear slot on the timeline. Think of it as laying out the big pieces of your Agile puzzle—specific enough to guide you, but loose enough to shift as needed.
2. List Tasks and Dependencies
Next, dive into each sprint and list key tasks or user stories, noting their estimated durations and dependencies. For instance, in Sprint 1, "Wireframes (3 days)" might need to finish before "Frontend Coding (5 days)" can begin in Sprint 2. Be sure to capture these links—dependencies are the heartbeat of an agile Gantt chart, showing how tasks flow across sprints. Keep it simple: focus on deliverables like "Backend API Setup" rather than every subtask, so the chart stays clear and useful.
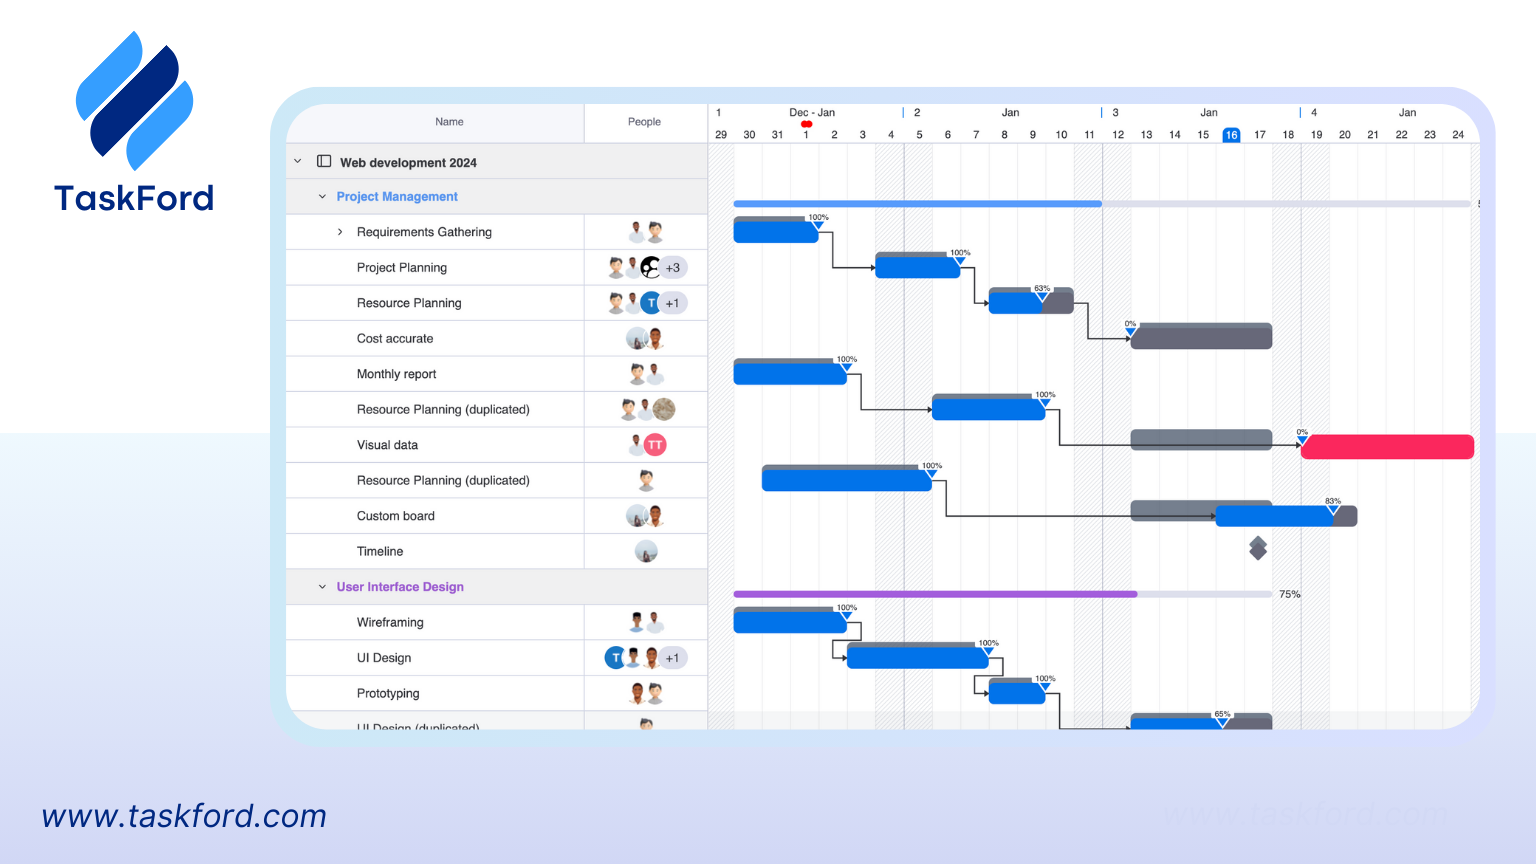
3. Build the Chart with the Right Tool
Now, bring your plan to life by plotting tasks on a timeline. Use a Scrum-friendly tool like Taskford to create your agile Gantt chart. Input your sprints and tasks, then drag them into place—Taskford’s flexibility lets you adjust durations and dependencies with ease. Don’t overplan beyond the current sprint; the beauty of an agile Gantt chart is its ability to stay light and adaptable. By the end, you’ll have a visual roadmap—like "Sprint 1: Wireframes" feeding into "Sprint 2: Frontend"—that’s easy to scan and tweak.
4. Update Regularly to Reflect Reality
Scrum thrives on feedback, and your agile Gantt chart should too. After each sprint review, revisit the chart to incorporate new priorities, scope changes, or lessons learned. Did a client request a new feature? Shift "Sprint 3: Testing" to make room for "Sprint 3: Feature X." Regular updates keep the chart aligned with your team’s evolving goals, ensuring it remains a living tool rather than a static relic. Aim for a quick refresh at the end of each sprint—five minutes can save hours of confusion later.
Best Practices for Using an Agile Gantt Chart Effectively
To get the most out of your agile Gantt chart in Scrum, follow these tips for success:
- Keep It High-Level: Focus on milestones that matter—like "Complete Backend Integration"—rather than micromanaging every detail. A cluttered chart loses its purpose; aim for clarity over complexity. For example, track "User Login Development" as one bar, not its dozen sub-steps.
- Use Colors for Visual Impact: Highlight sprints or critical tasks with color coding—say, blue for Sprint 1 and red for must-hit deadlines. This makes the chart scannable during planning sessions or stakeholder updates, saving time and boosting understanding.
- Stay Adaptable: Agile means change, so don’t stress when a sprint goal shifts. If "Payment Integration" moves from Sprint 2 to Sprint 3 after a pivot, update the agile Gantt chart without hesitation. Flexibility is its strength—embrace it.
Tools to Build an Agile Gantt Chart
Creating an agile Gantt chart is easier with the right software. Here are some top options for Scrum teams:
- TaskFord: Built for Agile workflows, Taskford offers agile Gantt chart features that let you adjust timelines in real-time and sync with sprint planning.
- Jira: Add-ons like TeamBoard ProScheduler turn Jira into a Gantt-friendly tool for Scrum.
- Trello: Brings basic Gantt visuals to your boards, enhancing Agile tracking.
- Microsoft Project: A traditional choice with Agile customization, though less intuitive for sprints.
TaskFord stands out for its simplicity and focus on Agile project tracking. With drag-and-drop updates and sprint-specific views, it’s a go-to for teams wanting an agile Gantt chart without the clutter of traditional tools. Compare these options based on your team’s needs—flexibility is key in Scrum.
Agile Gantt Chart vs Scrum Board: Which One Should You Use?
Scrum teams often rely on Scrum boards (like Kanban boards) to track daily progress. These boards shine during stand-ups, showing tasks in "To Do," "In Progress," and "Done" columns. But for long-term planning? They fall short. That’s where an agile Gantt chart steps in.
- Scrum Board: Perfect for sprint-level visibility and daily updates.
- Agile Gantt Chart: Ideal for high-level planning and cross-sprint dependencies.
The best approach? Combine them. Use a Scrum board for day-to-day task tracking and an agile Gantt chart for a broader project overview. Together, they create a powerhouse duo for Scrum success. Refer to this blog to learn more about Gantt Chart vs Kanban.
Conclusion
An agile Gantt chart is your Scrum team’s bridge between chaos and clarity—simplifying planning, untangling dependencies, and uniting teams with stakeholders. Don’t let outdated Gantt myths hold you back; this hybrid tool proves Agile can have structure without shackles. Start experimenting with TaskFord’s agile Gantt chart today—your next sprint could be your smoothest yet! New to Gantt charts? Visit What is a Gantt Chart or master the details in Gantt Chart 101.

Making work simpler,
smarter, and more connected
Join our waitlist and be notified first.

Related Blog
Subscribe for Expert Tips
Unlock expert insights and stay ahead with TaskFord. Sign up now to receive valuable tips, strategies, and updates directly in your inbox.