How to Use a Gantt Chart for Marketing Projects and Campaigns
Discover how to use Gantt charts for marketing projects with Taskford, enhance timelines and boosting team coordination.
Gantt charts are a powerful tool for managing marketing projects and campaigns, offering a visual way to plan, track, and execute complex tasks. For marketing teams juggling multiple campaigns, deadlines, and stakeholders, a Gantt chart can bring clarity and structure to the process.
This blog post explores how to use a Gantt chart effectively for marketing projects, with practical insights to help you streamline workflows, meet deadlines, and achieve campaign goals. Whether you're new to Gantt Charts or looking to refine your approach, this guide will provide actionable steps and tips to optimize your marketing efforts.
What Is a Gantt Chart and Why Use It for Marketing?
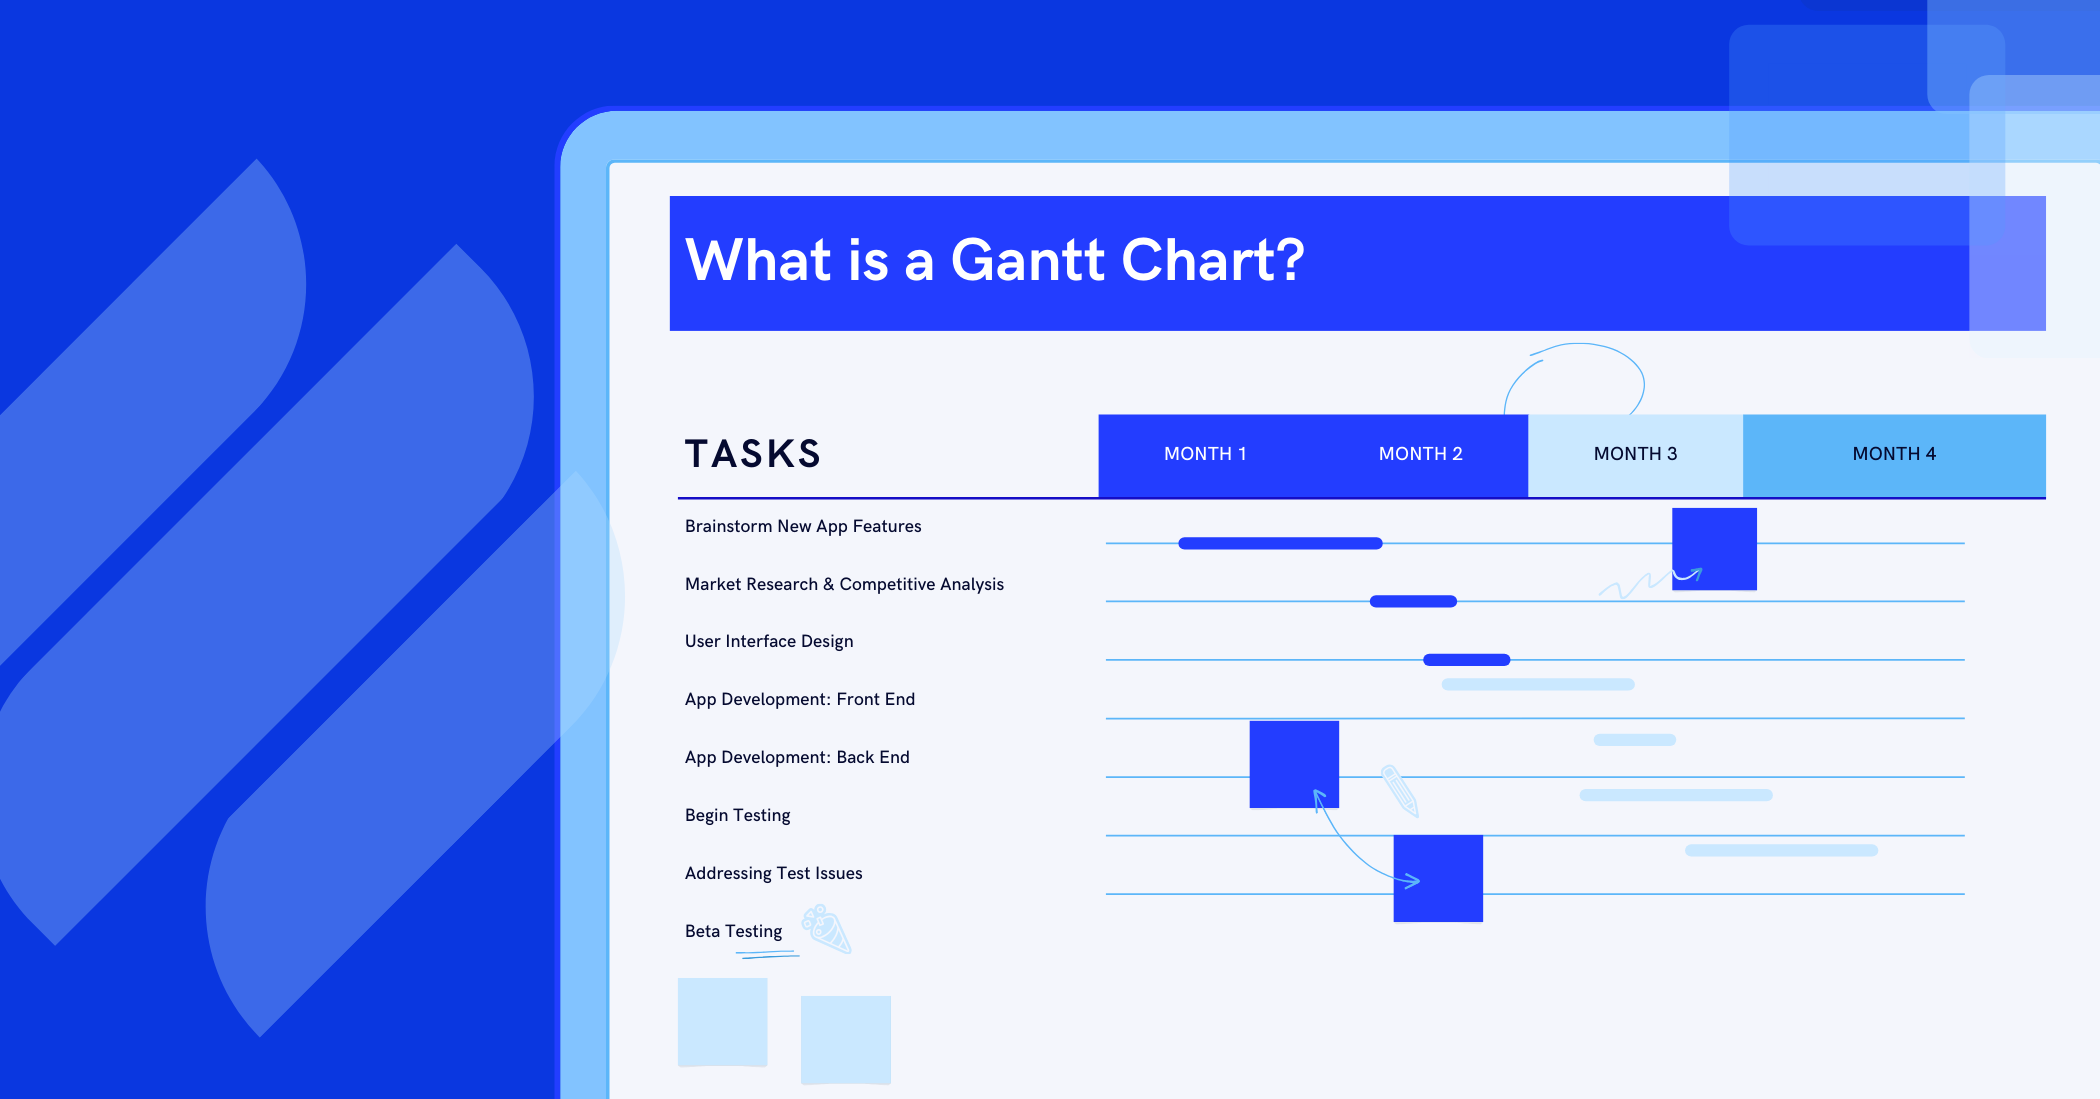
A Gantt chart is a visual project management tool that displays tasks along a timeline, showing start and end dates, dependencies, and progress. In marketing, where campaigns often involve multiple teams, deliverables, and deadlines, Gantt charts help keep everyone aligned. They provide a clear overview of tasks, highlight critical paths, and ensure resources are allocated efficiently.
Effective marketing campaigns rely on thorough market research to understand customer needs, competition, and market trends. As outlined in a business.com article, a well-structured market research plan helps marketers identify opportunities, reduce risks, and align strategies with consumer behavior.
By integrating insights from such research into a Gantt chart, marketing teams can prioritize tasks and timelines that reflect data-driven decisions, ensuring campaigns resonate with target audiences and achieve strategic goals.
For marketing projects, Gantt charts are particularly useful because they:
- Visualize campaign timelines: See when tasks begin and end, ensuring campaigns launch on time.
- Track dependencies: Understand how tasks like content creation or design approvals impact other activities.
- Improve team coordination: Keep all stakeholders, designers, copywriters, and media buyers on the same page.
- Monitor progress: Quickly identify delays or bottlenecks to keep projects on track.
Learn more: What is a Gantt Chart?
How to Read a Gantt Chart
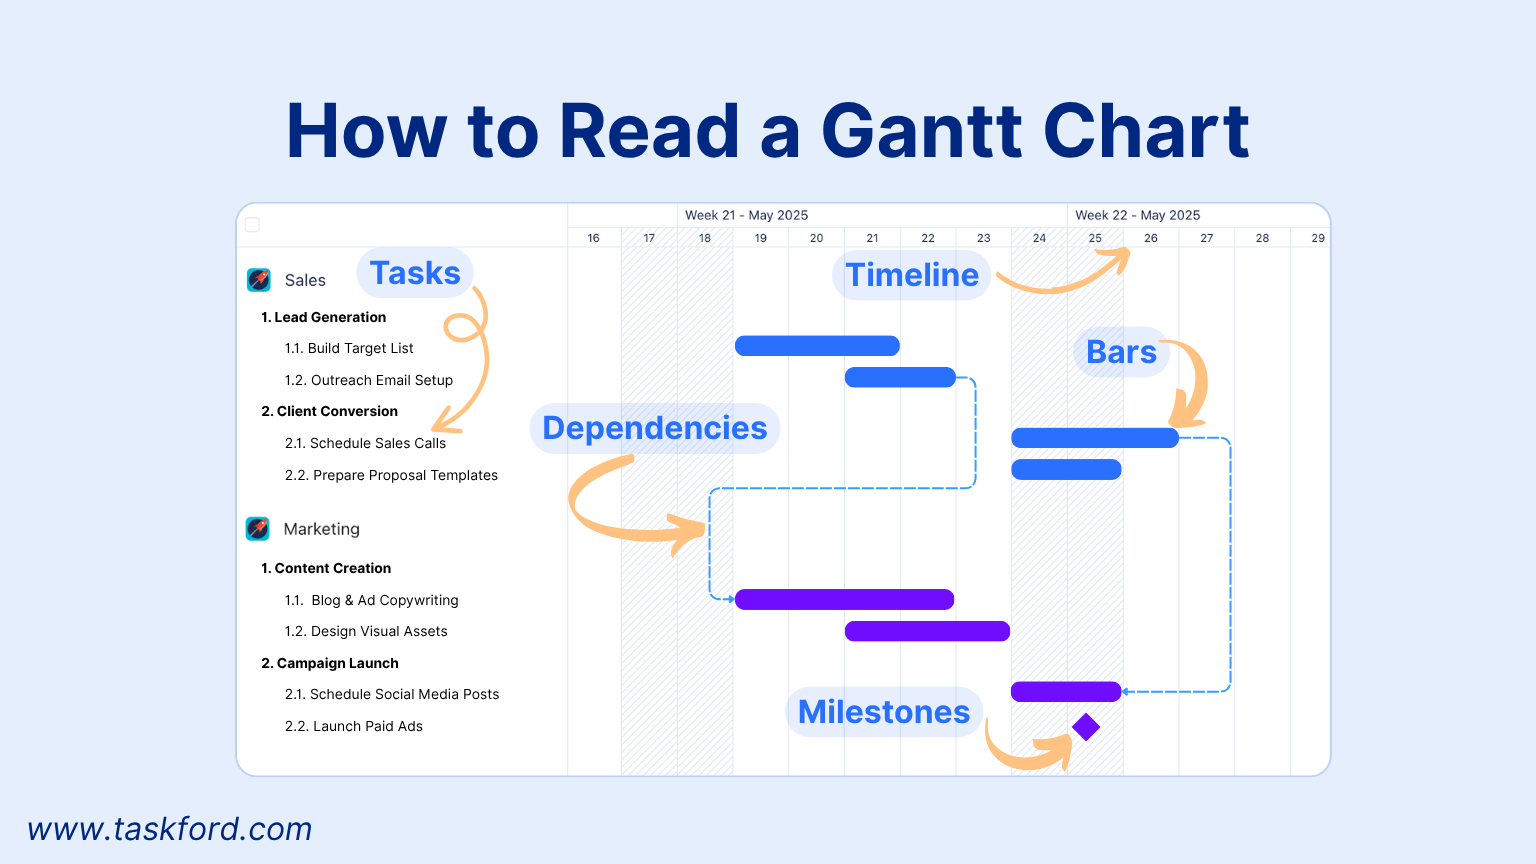
Before diving into how to use a Gantt chart, it’s important to understand its components. A typical Gantt chart includes:
- Tasks: Listed vertically, these represent individual activities, such as "Create social media content" or "Launch email campaign."
- Timeline: Displayed horizontally, this shows the duration of the project, often broken into days, weeks, or months.
- Bars: Each task is represented by a bar, with its length indicating the task’s duration and position showing its start and end dates.
- Dependencies: Arrows connecting tasks show which activities must be completed before others can begin.
- Milestones: Key dates or deliverables, like a campaign launch, are marked with symbols (e.g., a diamond).
Understanding key components of a Gantt chart, you can interpret timelines, spot potential delays, and communicate progress effectively.
How to Use a Gantt Chart for Marketing Projects with Taskford
Before we dive into the step-by-step process, it’s worth highlighting that Taskford isn’t just built for visual planning, it’s a full-featured project management platform designed to help marketing teams stay organized and agile. From drag-and-drop task dependencies to real-time progress tracking and automated scheduling, Taskford’s Gantt chart view is deeply integrated with core project management capabilities.
If you're new to structured planning or want to improve your team’s overall coordination, check out our Project Management Guide for a broader framework to complement your campaign planning.
Here’s a practical guide to using a Gantt chart for marketing campaigns. Each step integrates Taskford’s functionality and illustrates how it supports a real-world campaign.
Step 1: Define Your Marketing Project Scope
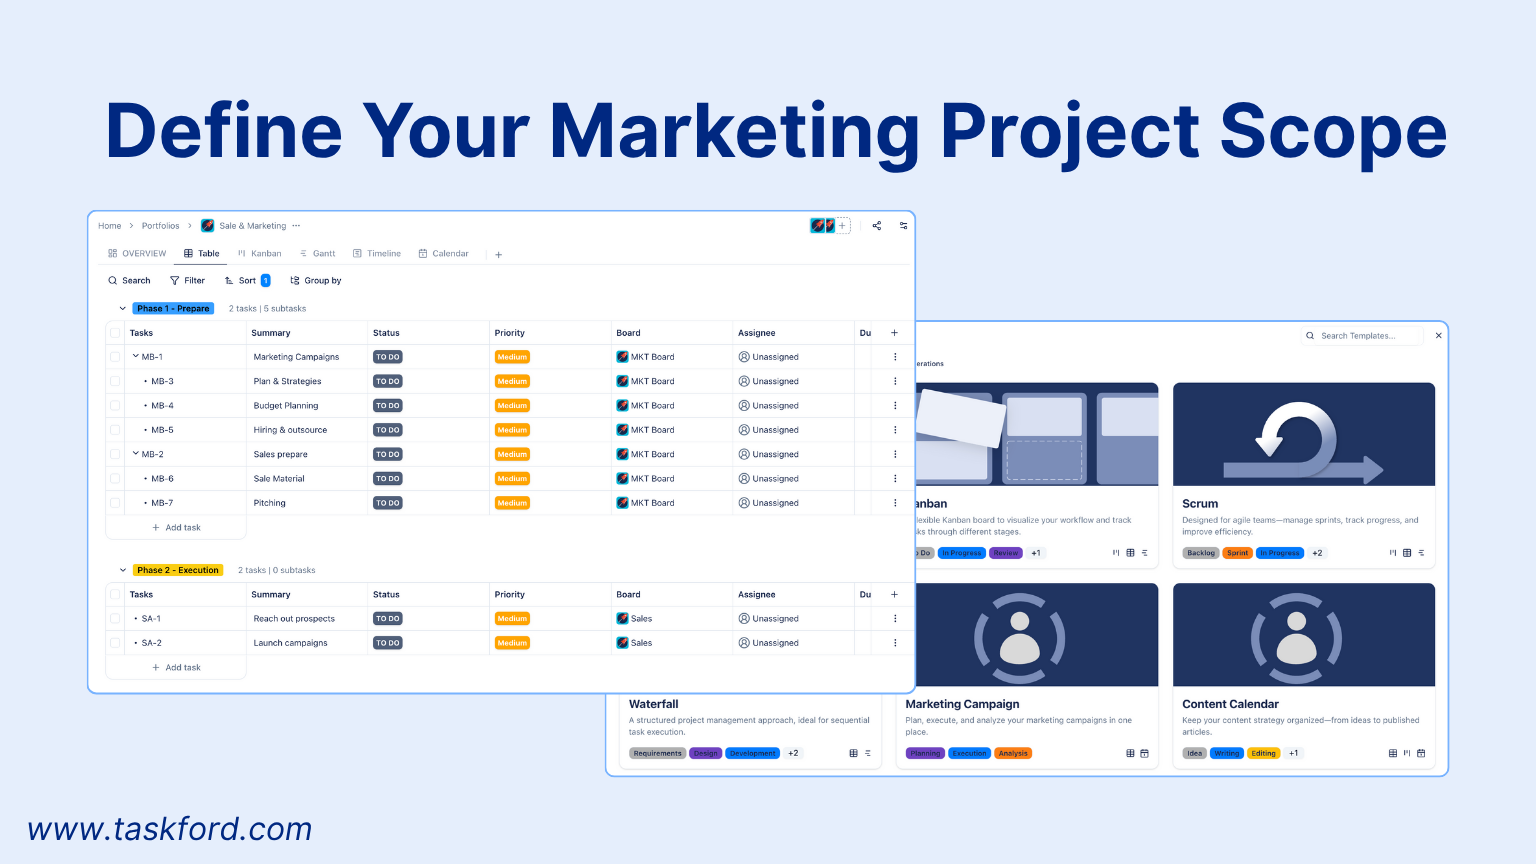
- In Taskford, create a new board for your marketing project using a pre-built template like Marketing Campaign, Content Calendar, SEO & Performance Tracking, Event Planning, or start with a Blank Board for full customization.
- Define project phases and corresponding tasks in Taskford’s table view, where you can easily create tasks and group them by phase (e.g., Planning, Content Creation, Execution).
- Use the Add Description and Attachment features to include detailed objectives, such as campaign goals or key deliverables, for each task or phase.
Example:
For a product launch campaign, aiming to drive 10,000 clicks to a landing page, create a Marketing Campaign board in Taskford. Set up phases like “Planning,” “Content Creation,” “Approvals,” and “Launch.”
In table view, add tasks such as “Conduct audience research” and “Develop creative brief” under the Planning phase.
Step 2: List Tasks and Assign Durations
Break down tasks into smaller, detailed subtasks within a hierarchy structure to ensure clarity.
- In Taskford’s table view, create subtasks under main tasks to organize the workflow.
- Set start and end dates for each task to establish timelines.
- Assign resources using the Assignee field in table view or directly in the Gantt chart.
Taskford also supports fields like Status, Priority, and Tags to categorize tasks (e.g., “High Priority” for urgent tasks or “Content” for creation tasks), enhancing organization and tracking.
Example:
For the product launch, break down the “Content Creation” phase into subtasks: “Create visuals” (3 days), “Write captions” (2 days), and “Test ad creatives” (2 days).
Assign the designer to “Create visuals” and the copywriter to “Write captions” using the Assignee field. Tag tasks with “High Priority” to emphasize their importance to the campaign launch.
Step 3: Identify Dependencies and Milestones
Identify task dependencies to ensure the correct sequence of activities. Review dependencies and mark key deliverables as milestones, such as campaign approvals or launch dates.
Learn more: Gantt Chart Dependencies
Example:
For the social media campaign, “Schedule posts” (Day 15) depends on “Client approval” (Days 13-14), which relies on completing “Create visuals” and “Write captions” (Days 6-10).
Mark the campaign launch (Day 28) and creative brief approval (Day 5) as milestones to highlight key deadlines.
Step 4: Build the Gantt Chart
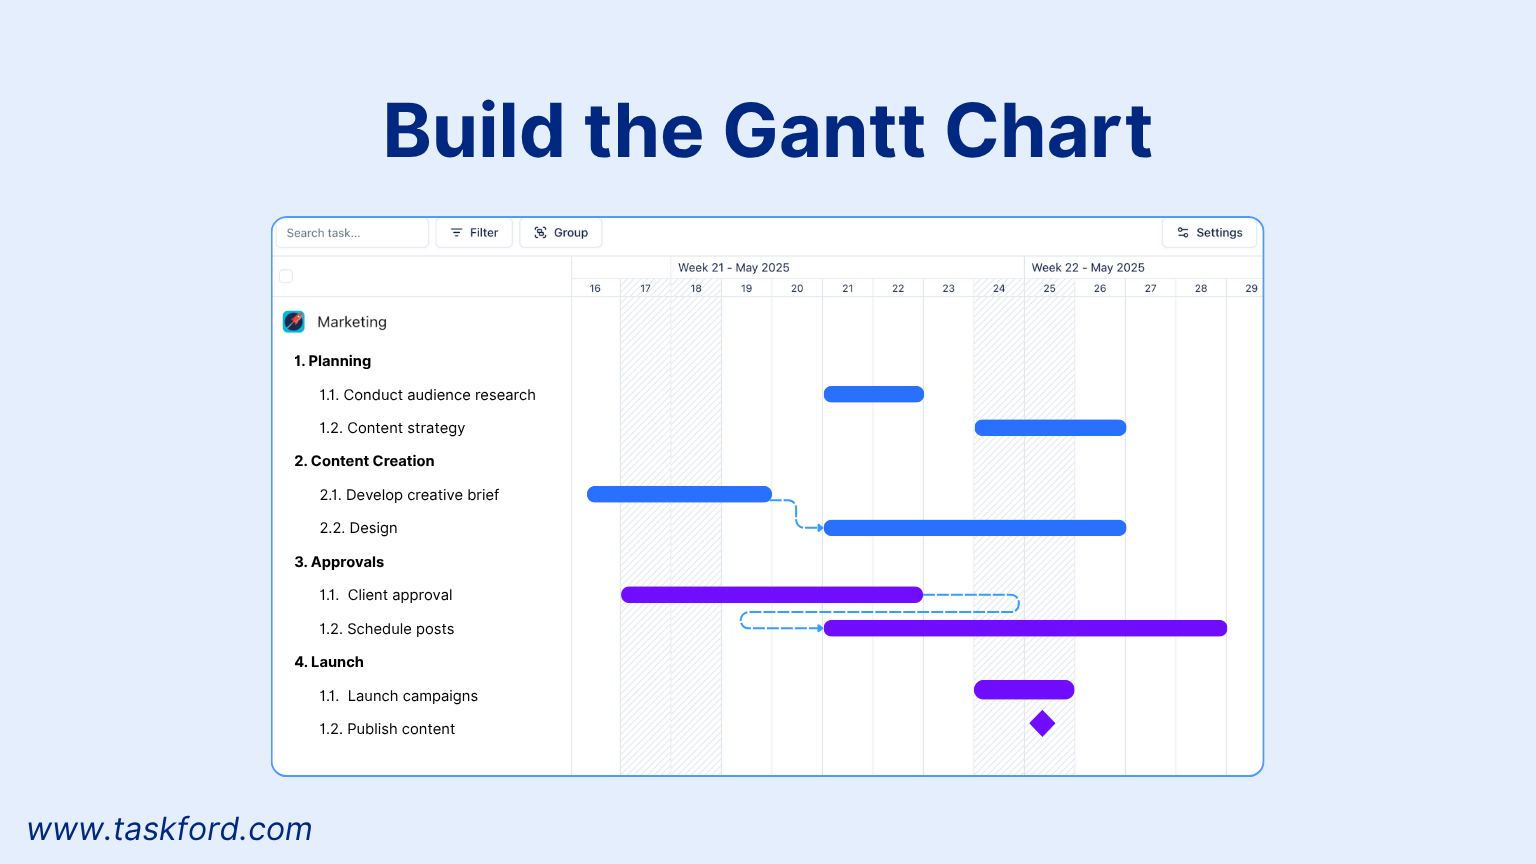
After defining the project structure, switch to Taskford’s Gantt View to map out tasks and dependencies. In the Gantt chart, add new tasks, assign team members, or adjust start and end dates directly as the campaign evolves.
- Drag the start and end points of Gantt bars (representing task durations) to set dependencies by connecting tasks. Taskford’s auto-scheduling feature adjusts dependent tasks automatically if one task’s timeline changes.
- Convert key tasks to milestones, which appear as diamond icons in the Gantt chart.
- Create a baseline at the initial Gantt chart setup to track deviations from the original plan.
- Enable the critical path feature to highlight tasks that directly impact the project’s completion date.
Learn more: How to Make a Gantt Chart in Projects?
Step 5: Customize and Track Tasks
- Use Taskford’s Group and Filter features to organize tasks by phase, assignee, or status for better visibility.
- Customize task colors in the Gantt chart based on group, assignee, status, or custom fields (e.g., color-code “Content Creation” tasks as blue).
- Leverage Comment, Activities, and Inbox features to facilitate team communication and track updates.
Step 6: Monitor and Update the Gantt Chart
Regularly update the Gantt chart in Taskford to reflect task progress, delays, or scope changes. Taskford’s real-time updates allow team members to mark tasks as complete, and the platform notifies stakeholders of changes. Schedule weekly check-ins to review the chart and address issues like delayed approvals. Compare progress against the baseline to identify deviations and adjust plans accordingly.
Step 7: Communicate with Stakeholders
Share the Gantt chart with your team and clients via Taskford’s sharing options, use the chart to clarify deadlines, highlight milestones, and provide status updates during meetings.
Taskford’s collaboration tools, like comments and activity tracking, ensure transparency and alignment.
Conclusion
Gantt charts are an invaluable tool for managing marketing projects and campaigns. By visualizing tasks, timelines, and dependencies, they help teams stay organized, meet deadlines, and deliver successful outcomes. To get started, define your project scope, choose the right software, and follow best practices like regular updates and clear communication. With these steps, you’ll be well-equipped to use Gantt charts to elevate your marketing efforts.
With Taskford’s powerful features, your marketing team can plan smarter, execute faster, and adapt with confidence.

Making work simpler,
smarter, and more connected
Join our waitlist and be notified first.

Related Blog


Subscribe for Expert Tips
Unlock expert insights and stay ahead with TaskFord. Sign up now to receive valuable tips, strategies, and updates directly in your inbox.