How to Make a Gantt Chart in Excel: A Step-by-Step Guide for Project Managers
Learn how to make a Gantt chart in Excel to plan tasks, track timelines, and manage projects - perfect for beginners and small teams.
If you're managing a project, you already know how important it is to stay organized, visualize progress, and keep your team aligned. One of the most effective tools for this is a Gantt Chart. While there are plenty of project management platforms like Taskford that offer built-in Gantt views, many teams still want to know how to make a Gantt chart in Excel - especially for one-off projects or when working without dedicated software. In this step-by-step guide, we’ll walk you through how to make a fully functional Gantt chart in Excel, even if you're just getting started with project planning.
What Is a Gantt Chart?
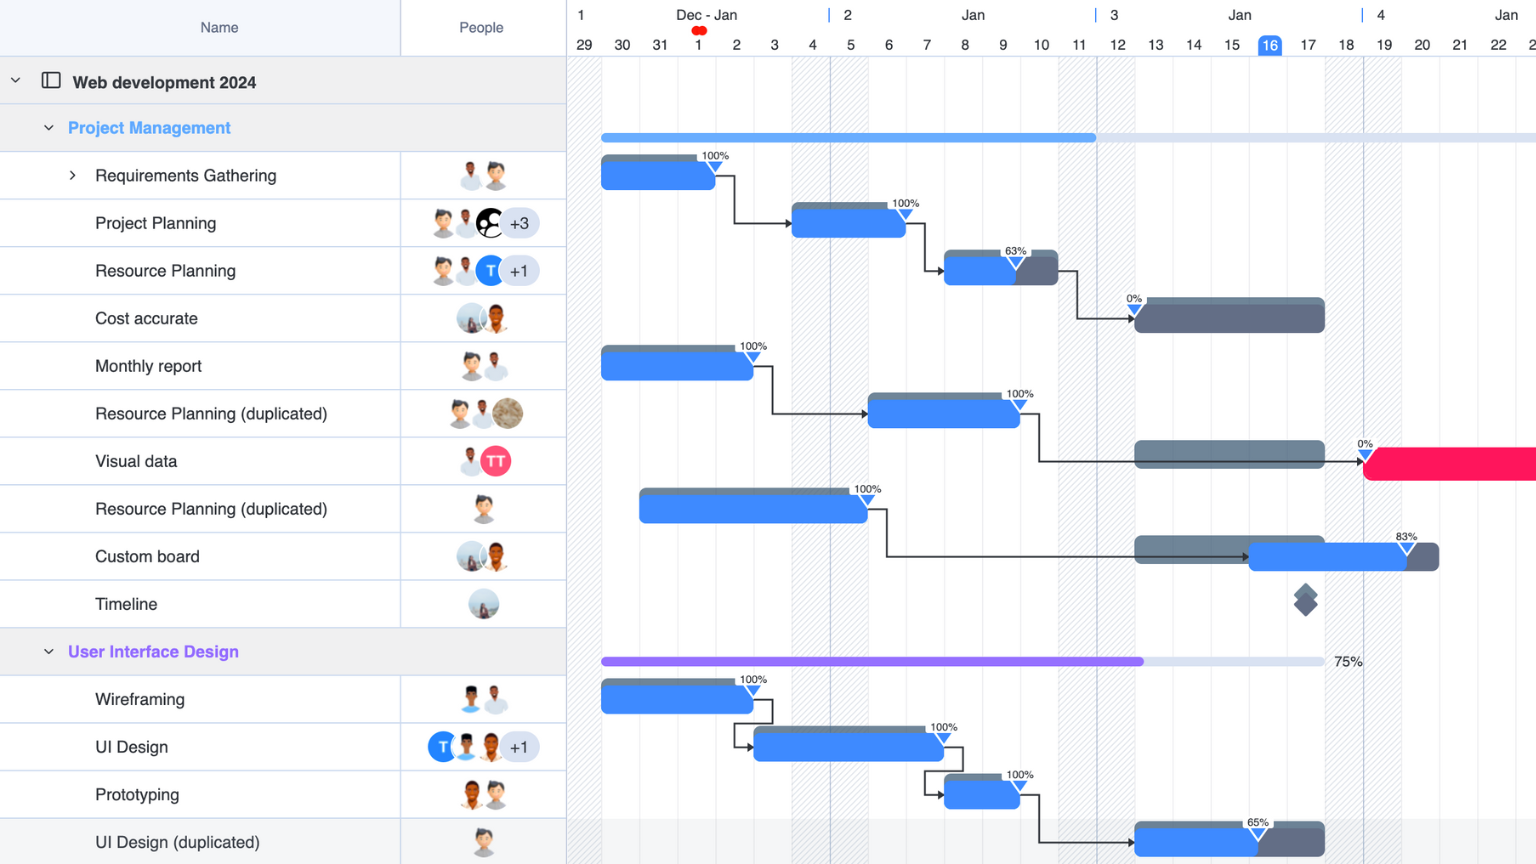
A Gantt chart is a powerful visual tool used in project management to map out tasks over time. It lays out your project timeline with tasks listed vertically and a time scale running horizontally. Each task is represented by a horizontal bar, indicating when the task starts and how long it will take.
Wondering why Gantt charts are so widely used? They help you:
- Clearly visualize your project schedule
- Spot task dependencies and key milestones
- Monitor progress at a glance
- Communicate effectively with your team and stakeholders
If you're new to Gantt charts or want a refresher, we’ve covered the basics in more detail here: What is a Gantt Chart?
Why Make a Gantt Chart in Excel?
If you're looking for a simple, accessible way to map out project timelines, making a Gantt chart in Excel is a great starting point. Excel offers a familiar interface and powerful customization options - perfect for small teams or solo planners who don’t yet need advanced project management tools.
Benefits of Making a Gantt Chart in Excel:
- No extra software needed: Excel is widely available across industries.
- Customizable design: Tailor your chart’s look, layout, and labels.
- Easy to share: Send it via email, cloud storage, or as a PDF.
- Ideal for smaller projects: Perfect for single-phase or short-term planning.
Limitations of Excel Gantt Charts:
- Manual updates: You’ll need to adjust dates and durations manually.
- No dependency tracking: Lacks built-in logic for task relationships.
- No real-time collaboration: Unlike Taskford, Excel doesn’t support live updates or automated reminders.
If you're just learning how to make a Gantt chart in Excel, it's a useful way to build visual timelines without added tools. But as your needs grow, Gantt Chart software offers a more dynamic and collaborative experience.
How to Make a Gantt Chart in Excel (Step-by-Step Guide)
Creating a Gantt chart in Excel is a practical solution for managing simple project timelines without needing specialized software. Below is a step-by-step guide that shows you exactly how to build one using Excel, with a real-world example to follow along.
Step 1: Prepare Your Project Data
The first step in making a Gantt chart in Excel is organizing your project tasks in a table. At a minimum, you should include columns for the task name, start date, and duration (in days).
For example, imagine you're managing a website launch project. Your Excel table might look like this:
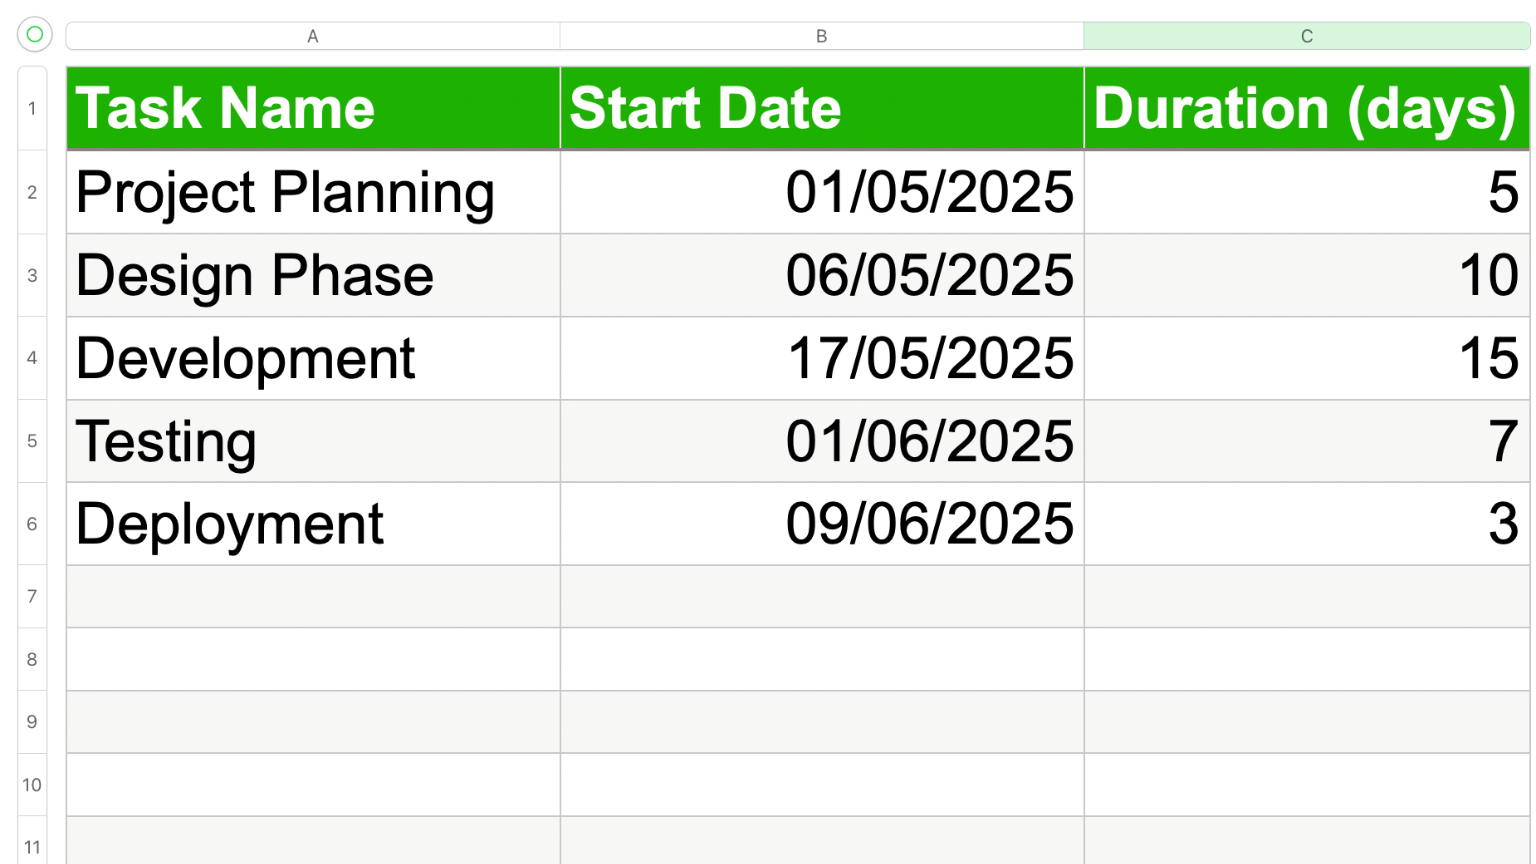
This structure gives you the basic data needed to build the chart. Be sure all dates use a consistent format, such as DD/MM/YYYY or MM/DD/YYYY, depending on your region.
Step 2: Calculate End Dates (Optional)
Although not essential for creating the chart, calculating the end date for each task can help you better manage overlapping activities and dependencies.
In Excel, you can calculate the end date by adding the duration to the start date. For example, if your Start Date is in cell B2 and the Duration is in C2, the formula for the End Date would be: =B2 + C2
Apply this formula down the column to generate end dates for each task.
Step 3: Insert a Stacked Bar Chart
Once your data is ready, the next step is to visualize it as a Gantt chart. Here's how to insert a basic stacked bar chart:
- Select your task data, specifically the Task Name, Start Date, and Duration columns.
- Click the Insert tab on the Excel ribbon.
- In the Charts group, choose Bar Chart, then select Stacked Bar.
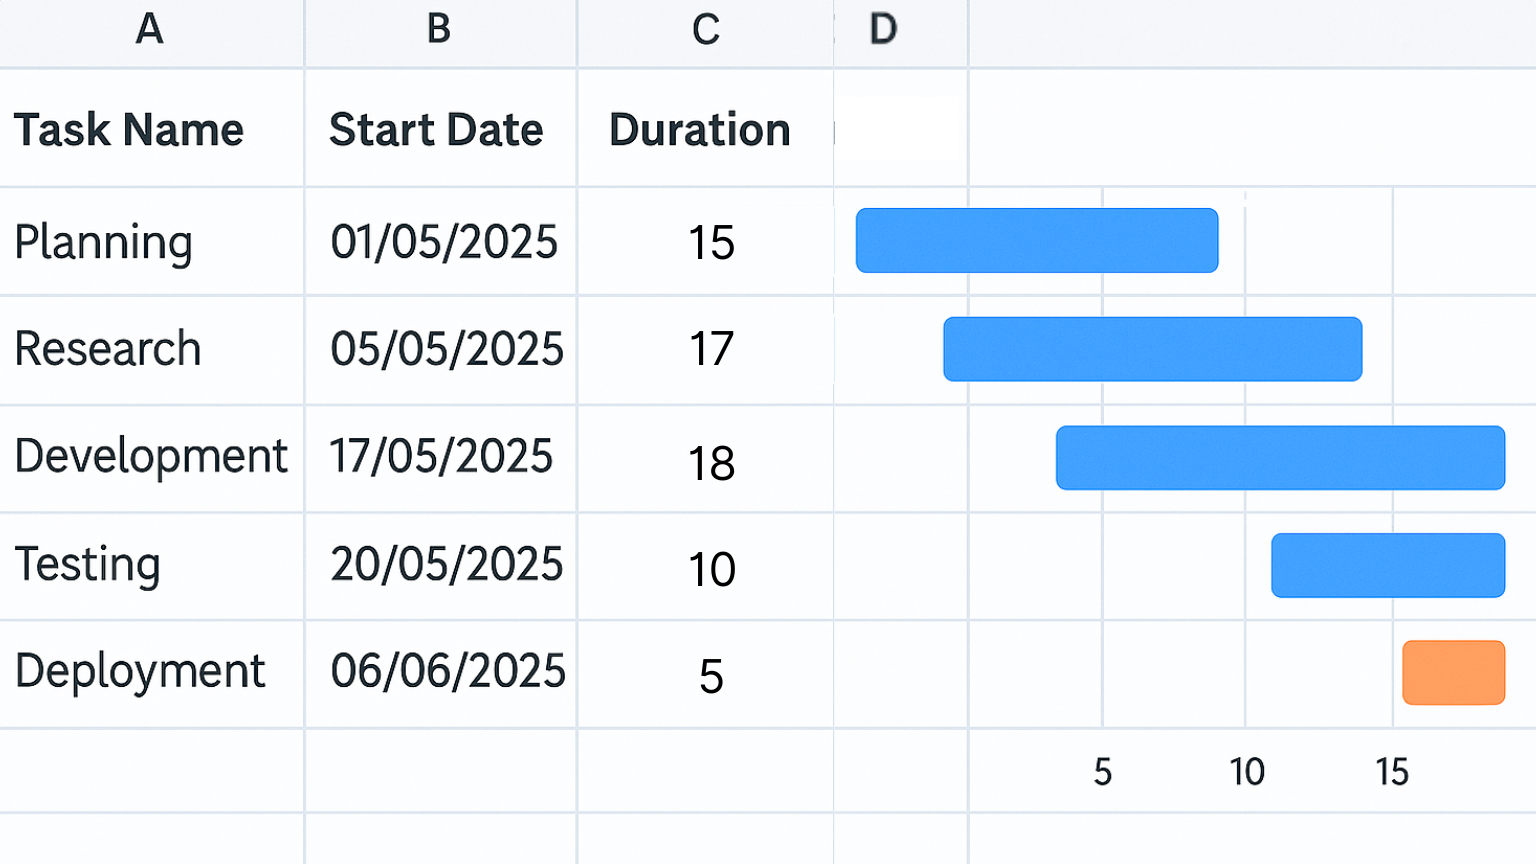
This will insert a chart showing each task as a stacked bar, with the start date forming the invisible portion and the duration forming the visible part.
Step 4: Format the Chart to Look Like a Gantt Chart
At this point, the chart won’t yet look like a traditional Gantt chart. To adjust it:
- Click on the chart to select it.
- Click on the first series in the bars (which represents the Start Date).
- Right-click and choose Format Data Series.
- In the format pane, set the fill color to No Fill.
This hides the start portion of the bar and leaves the duration bars aligned to the correct dates.
Step 5: Adjust the Task Order
By default, Excel displays taskbars from bottom to top, which is the reverse of most standard Gantt charts. You can fix this by adjusting the axis:
- Click on the vertical axis that lists the task names.
- Right-click and select Format Axis.
- In the axis options pane, check the box labeled "Categories in reverse order."
This reorders the tasks from top to bottom in chronological order.
Step 6: Customize the Gantt Chart
Now that your chart is functional, you can customize it to improve readability and appearance.
- Change the bar colors to differentiate between phases or team assignments.
- Adjust the horizontal (date) axis to match the full duration of your project.
- Add gridlines or modify the date range to make the chart easier to interpret.
- If needed, add data labels to show task durations directly on the bars.
These small adjustments can turn a simple chart into a clear, professional project timeline.
Speed up your workflow by using keyboard shortcuts in Excel when updating or editing your Gantt chart. This can save time when making frequent adjustments.
Why Use Online Gantt Chart Software Instead of Excel?
While Excel is a convenient starting point for creating Gantt charts, it has its limitations - especially as projects grow more complex. That’s where online Gantt chart software comes in. Tools like Taskford are specifically built for project planning and offer features that go far beyond what Excel can handle.
The Limitations of Excel for Project Management
Excel is flexible, but creating and maintaining a Gantt chart in Excel often requires manual formatting, formulas, and frequent updates. There’s no built-in support for task dependencies, progress tracking, or collaboration. As your project scales, managing everything in a static spreadsheet becomes inefficient and error-prone.
The Advantages of Online Gantt Chart Tools
Online Gantt chart platforms are designed to make project management more dynamic, efficient, and team-friendly. Here’s what you get when you switch to a modern tool like TaskFord:
- Real-Time Collaboration: Team members can view, edit, and comment on the project timeline simultaneously.
- Drag-and-Drop Scheduling: Easily adjust task dates and durations without needing formulas or manual edits.
- Task Dependencies: Link tasks together to reflect dependencies, so changes automatically cascade through the schedule. Automatic Progress Tracking: Update task status and see real-time visual progress on your timeline.
- Notifications & Reminders: Keep everyone aligned with automatic updates when deadlines shift or new tasks are assigned.
- Cloud Access: Work from anywhere and never worry about version control or lost files.
When to Make the Switch
If you’re managing a small, one-time project, Excel may be sufficient. But as your team grows or your projects become more layered and deadline-sensitive, switching to a dedicated Gantt chart tool becomes essential.
Tools like TaskFord offer the structure and automation Excel lacks - helping you save time, avoid mistakes, and keep your team aligned.
Conclusion
Now that you know how to make a Gantt chart in Excel, you’ve got a powerful way to plan and visualize your projects - even without specialized software. It’s a great starting point for organizing timelines, tracking tasks, and staying on top of your goals.
But when your projects get bigger or your team needs to collaborate in real time, Excel can quickly fall short. That’s where TaskFord steps in, with drag-and-drop Gantt charts, progress tracking, and smart collaboration features built for growing teams.
Let’s explore smarter Gantt chart tools at TaskFord and see how easy project planning can be.

Making work simpler,
smarter, and more connected
Join our waitlist and be notified first.

Related Blog


Subscribe for Expert Tips
Unlock expert insights and stay ahead with TaskFord. Sign up now to receive valuable tips, strategies, and updates directly in your inbox.