Understanding PERT in Project Management: How It Differs from Gantt and CPM
Master PERT in project management to cut delays and handle uncertainty. Learn to create PERT charts, compare PERT vs. Gantt and CPM.
When managing complex projects, choosing the right planning tool can make or break your success. The Program Evaluation and Review Technique (PERT) is a powerful method for handling projects with uncertain timelines, such as software development or research initiatives. Unlike other tools, PERT focuses on estimating task durations and identifying the critical path to keep projects on track. This article explains what PERT is, how it works, and how it compares to Gantt charts and CPM in project management. With practical steps, real-world examples, and tips, you’ll learn how to use PERT to manage risks and deliver projects efficiently.
Before diving into this content, we recommend exploring the article “what is project management” first to gain a better understanding of PERT in project management.
What Is PERT in Project Management?
PERT is a project management technique designed to plan, schedule, and control tasks in projects with uncertain durations. Developed in the 1950s for the U.S. Navy’s Polaris missile program, PERT helps project managers map out tasks, estimate completion times, and identify the critical path - the sequence of tasks that determines the project’s shortest duration.
Unlike other methods, PERT uses three time estimates for each task:
- Optimistic Time (O): The shortest time a task could take under ideal conditions.
- Most Likely Time (M): The most realistic estimate based on typical conditions.
- Pessimistic Time (P): The longest time a task might take if things go wrong.
These estimates are combined using the formula TE = (O + 4M + P) / 6 to calculate the expected time (TE) for each task. This approach makes PERT ideal for projects with high variability, such as product development or infrastructure projects.
Why PERT Matters for Project Managers
Project managers often face challenges like missed deadlines or resource bottlenecks. PERT addresses these by:
- Providing realistic time estimates for unpredictable tasks.
- Highlighting the critical path to prioritize resources.
- Improving communication by visualizing task dependencies.
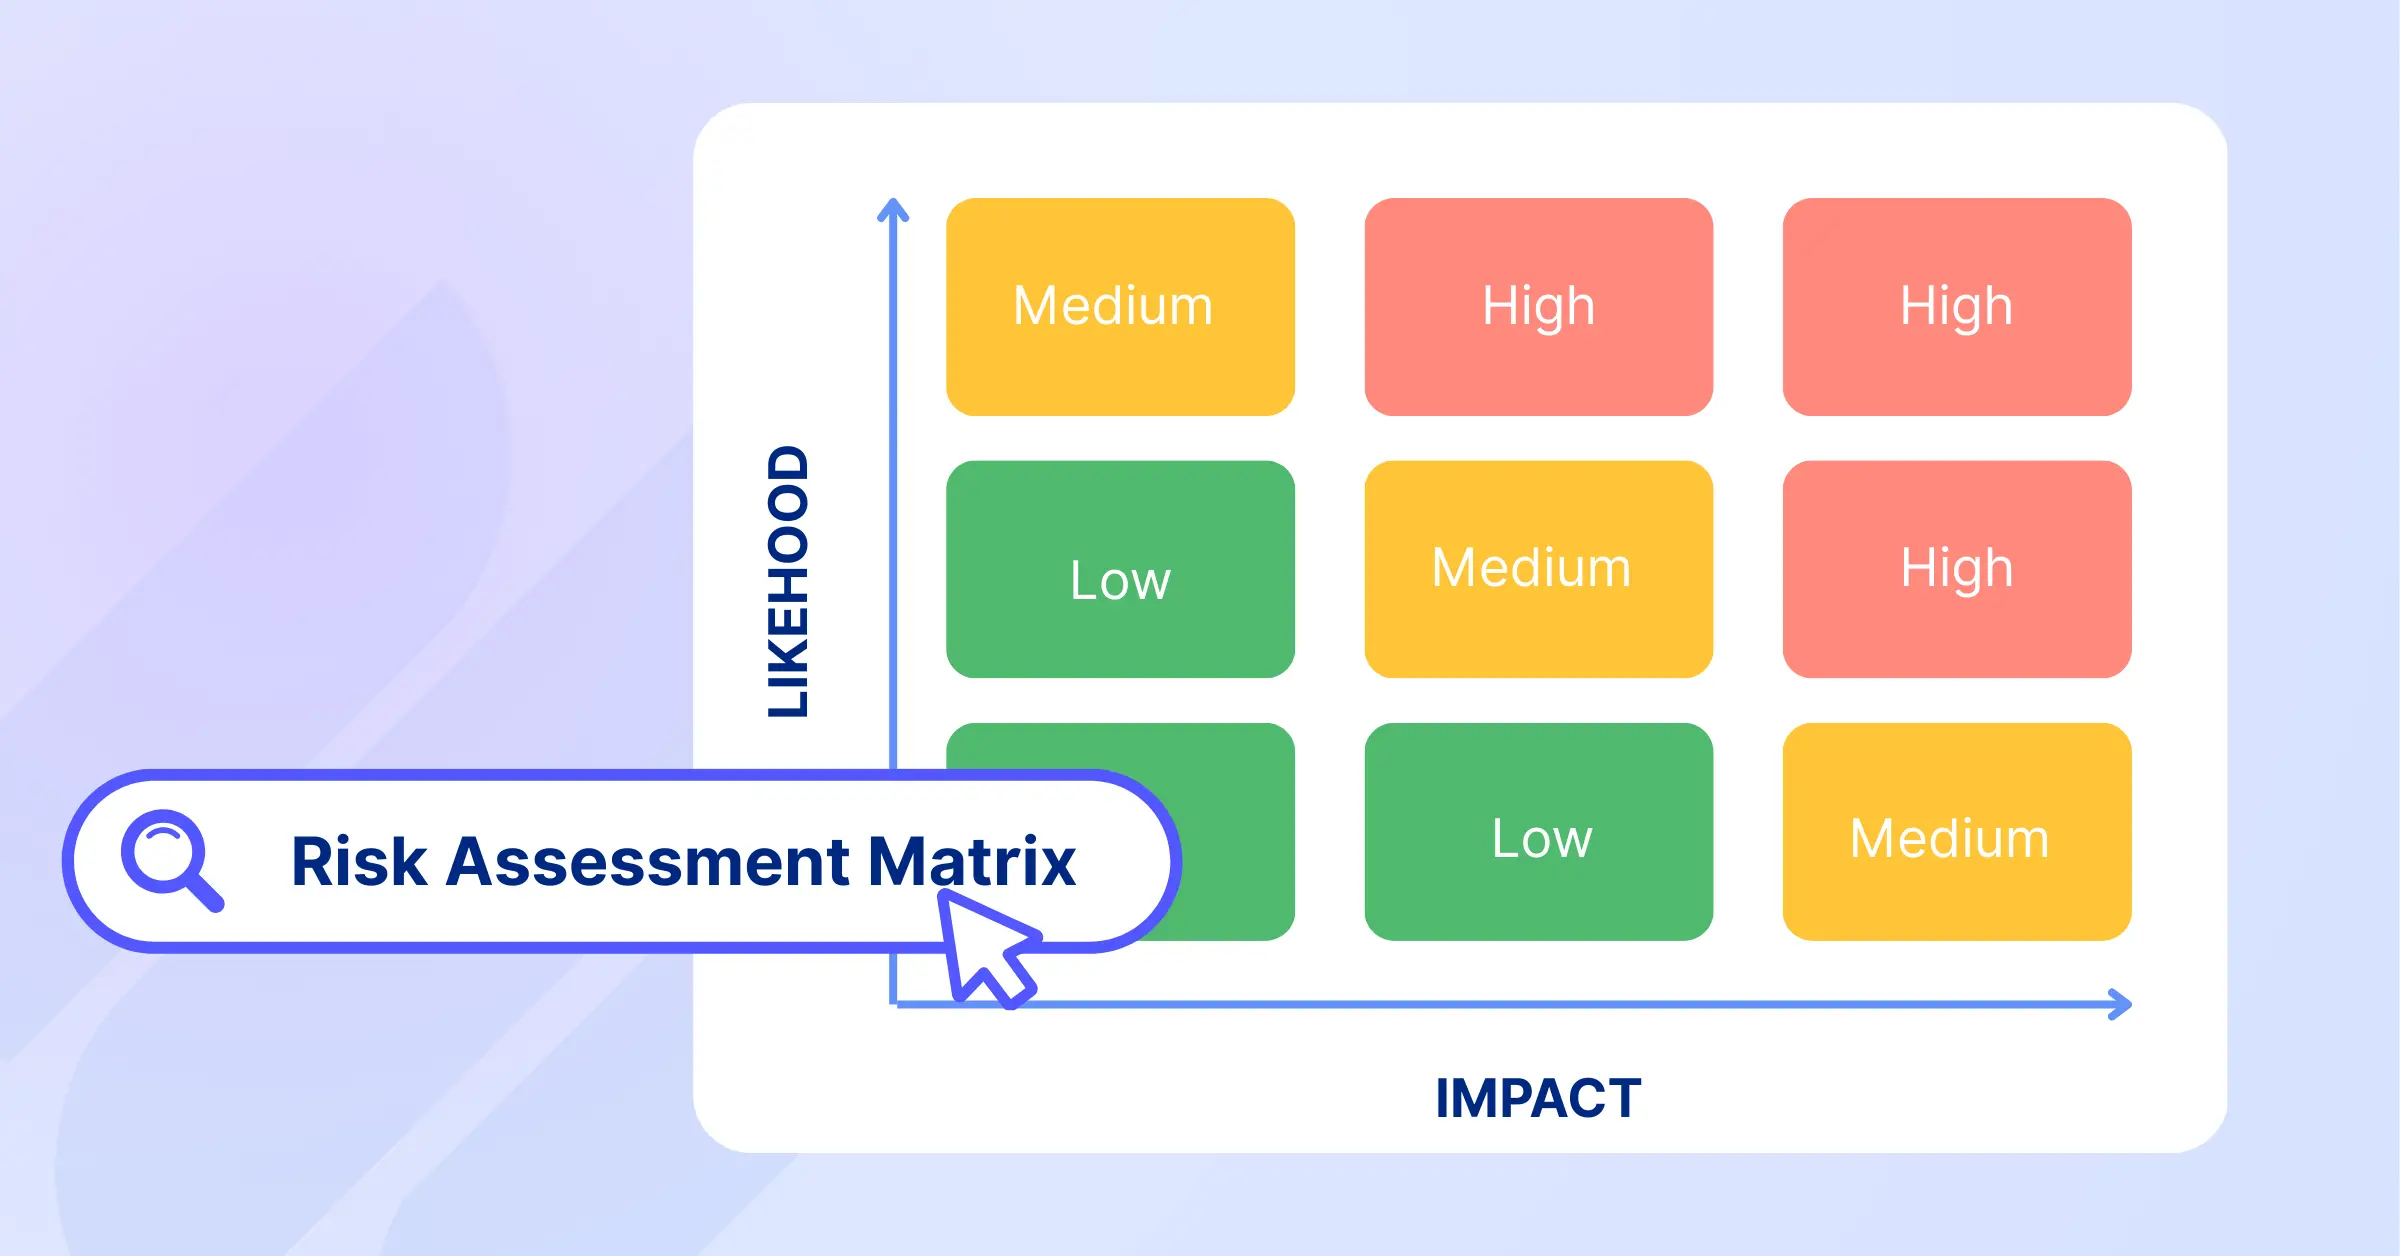
- Supporting risk management by identifying potential delays early.
How PERT Works in Project Management: A Step-by-Step Guide
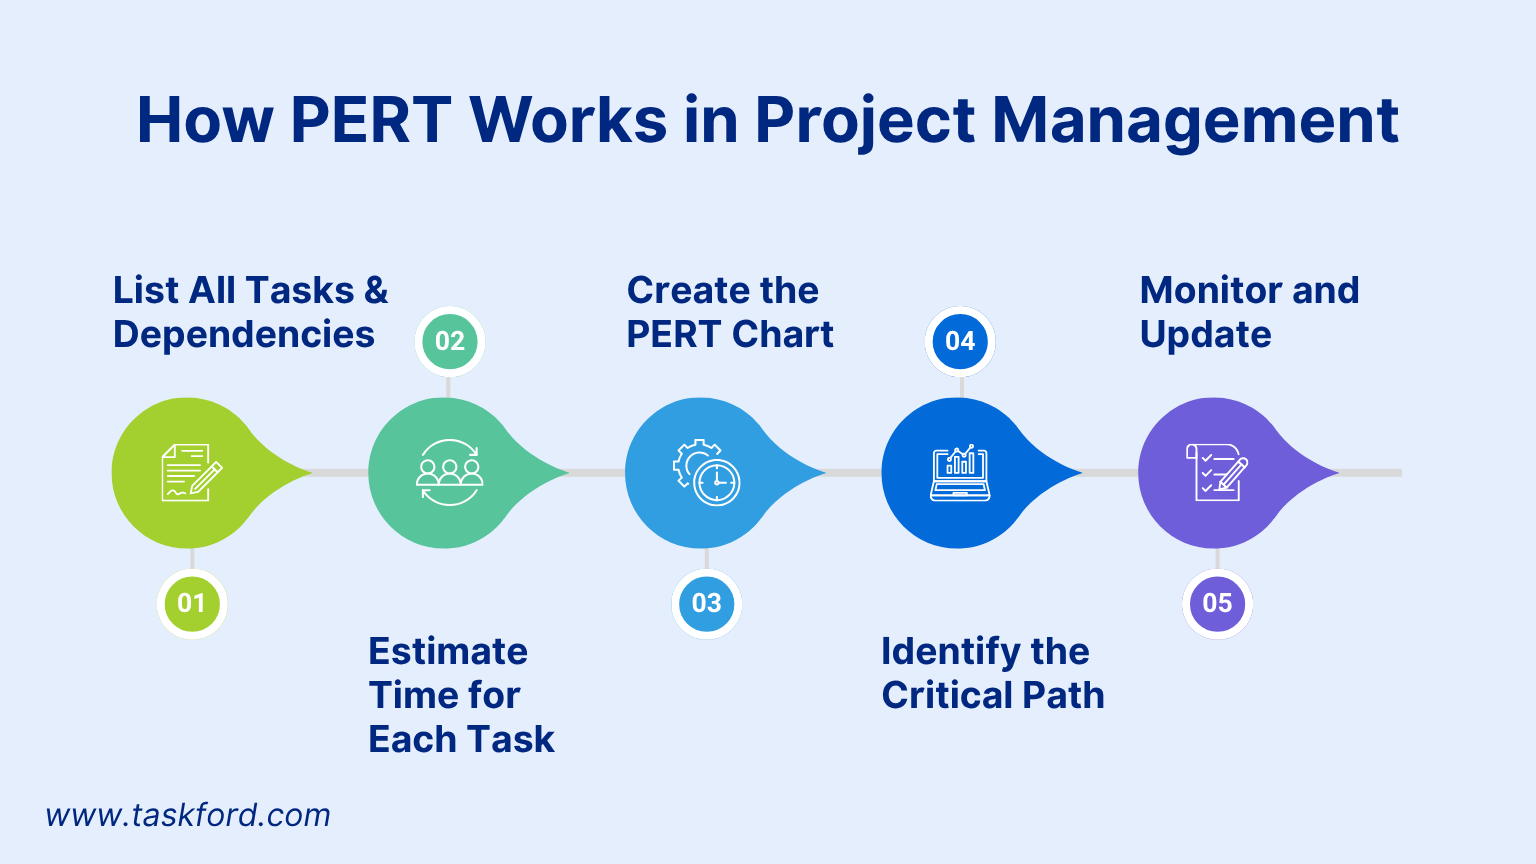
Creating a PERT chart and applying it to your project involves clear, actionable steps. Below is a practical guide to get started.
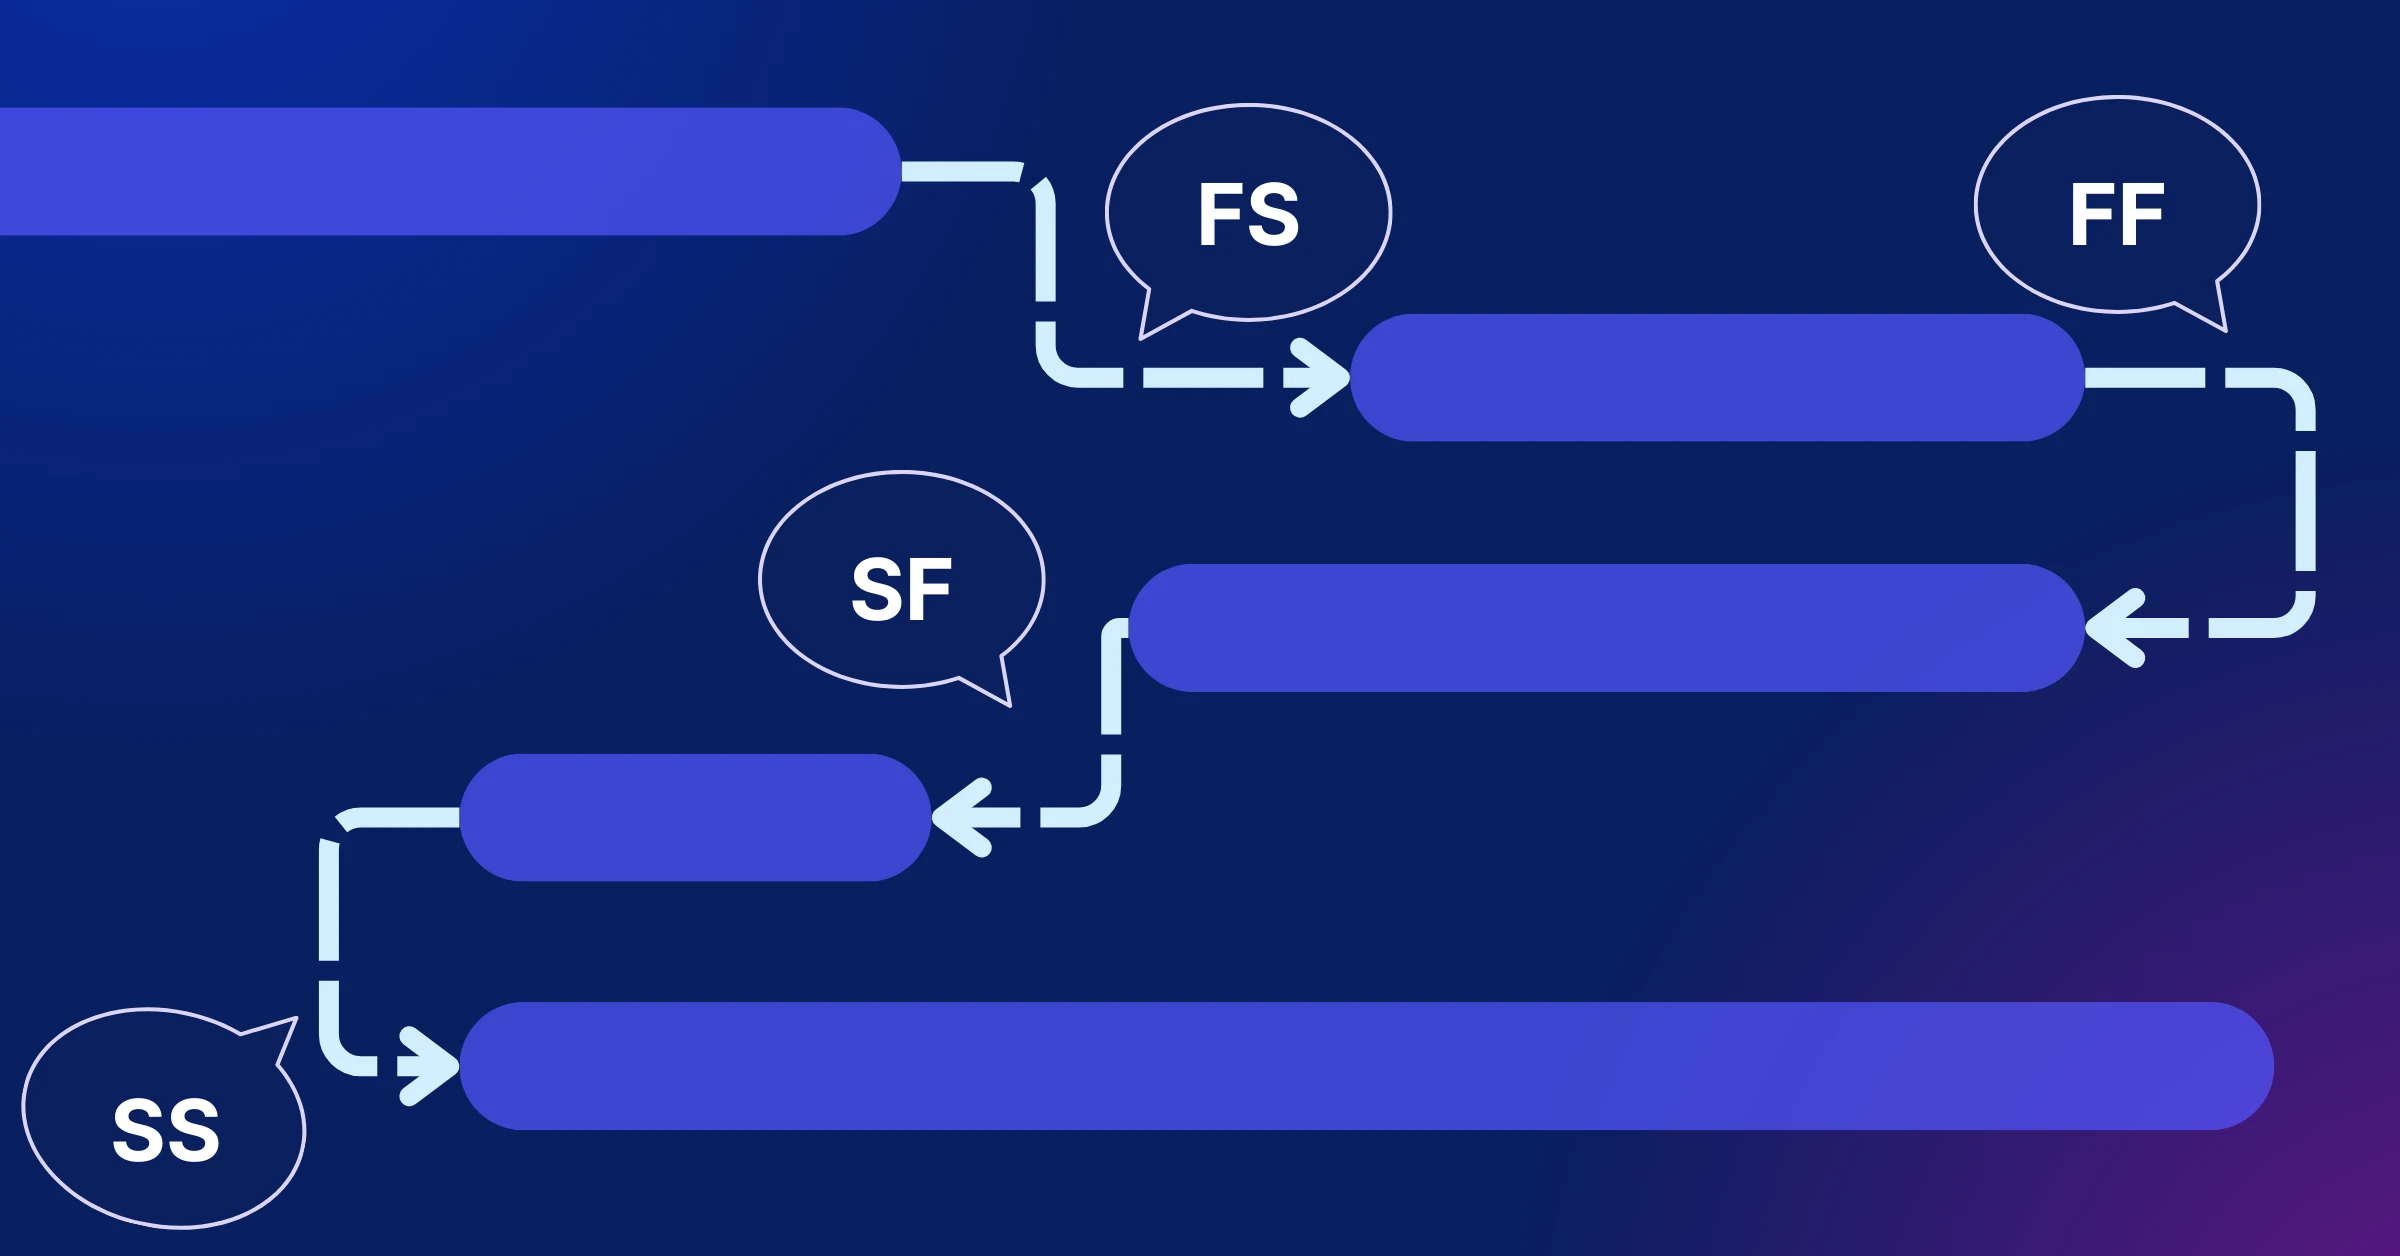
Step 1: List All Tasks and Dependencies
Identify every task required to complete the project and determine which tasks depend on others. For example, in a website development project, “design homepage” might depend on “finalize wireframes.”
Learn more: Dependencies in Project Management
Step 2: Estimate Time for Each Task
For each task, assign optimistic, most likely, and pessimistic time estimates. Suppose “design homepage” has:
- Optimistic: 3 days
- Most Likely: 5 days
- Pessimistic: 8 days
Using the PERT formula:
TE = (3 + 4*5 + 8) / 6 = 31 / 6 ≈ 5.17 days
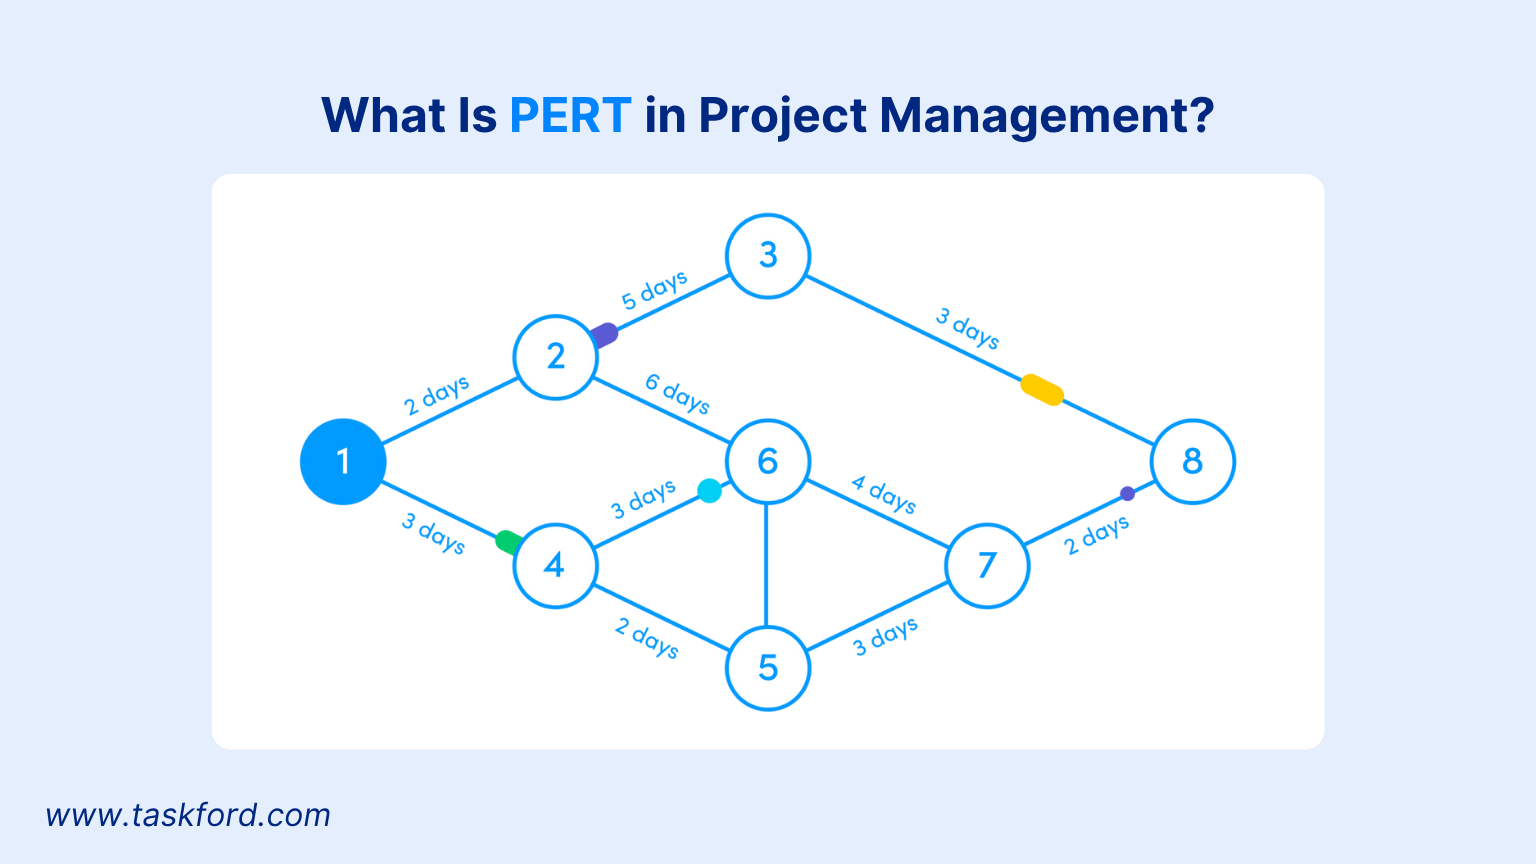
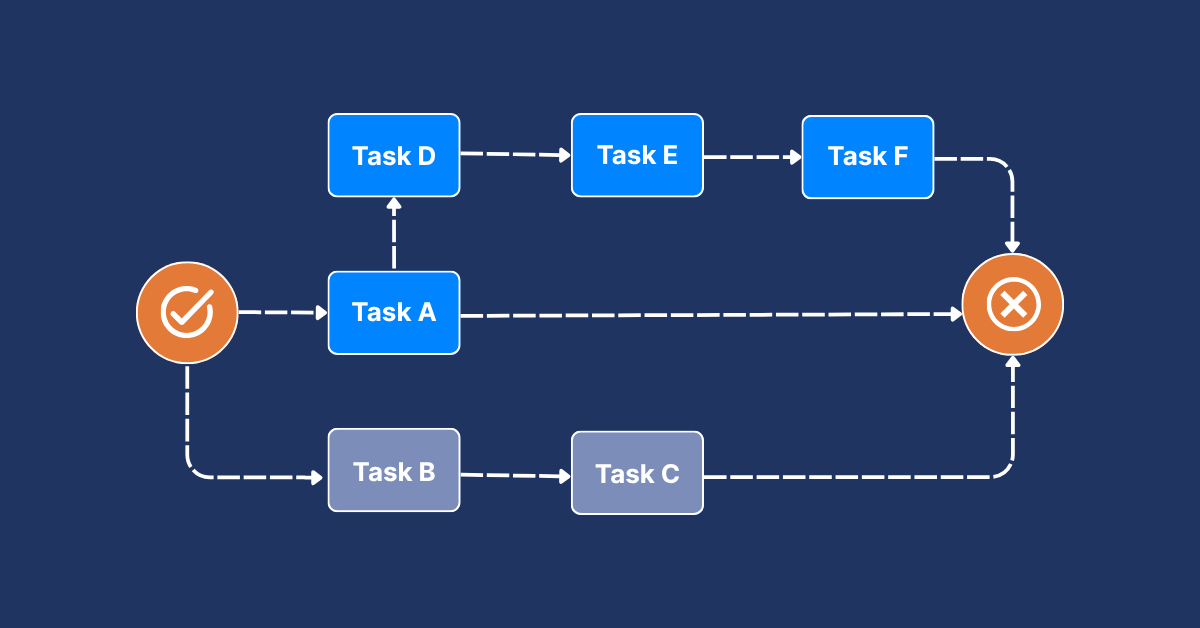
Step 3: Create the PERT Chart
Draw a PERT chart with:
- Nodes: Represent milestones or events (e.g., “Project Start” or “Website Launch”).
- Arrows: Represent tasks and their durations, connecting nodes to show dependencies.
For example, an arrow from “Finalize Wireframes” to “Design Homepage” shows that the latter cannot start until the former is complete.
Step 4: Identify the Critical Path
The critical path is the longest sequence of tasks determining the project’s minimum duration. Calculate the total time for each path through the chart and focus on the longest one. Any delay in critical path tasks will delay the entire project.
Step 5: Monitor and Update
As the project progresses, update the PERT chart with actual task durations. This keeps the schedule accurate and helps address delays early.
Example: In a software project, a PERT chart revealed that “user testing” was on the critical path. By allocating extra resources to this task, the team avoided a two-week delay.
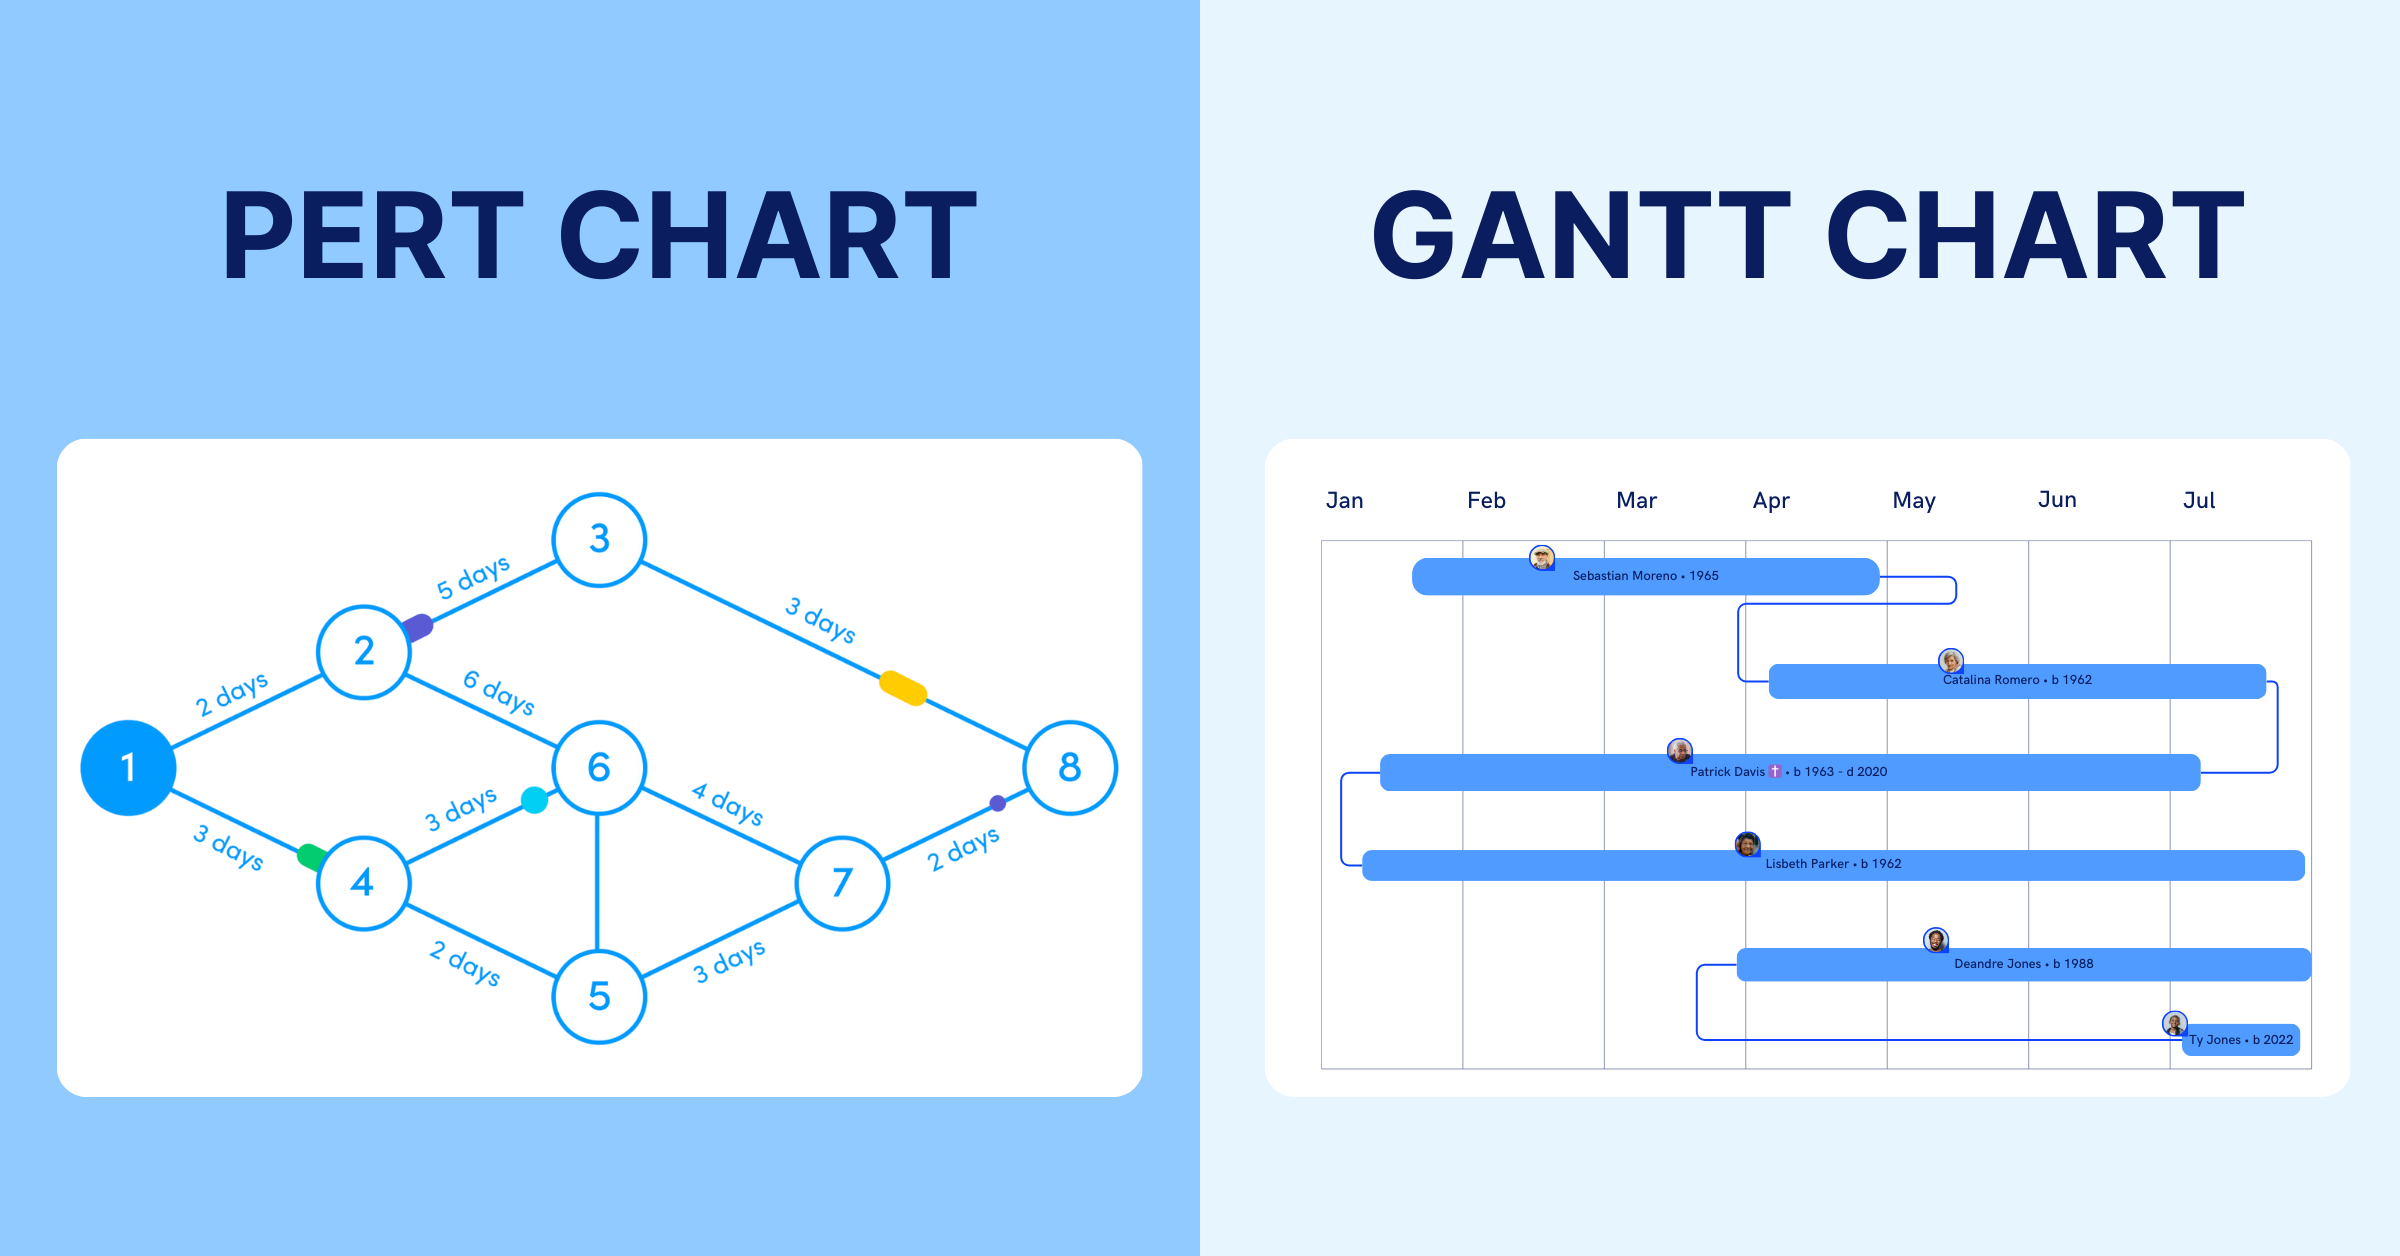
PERT vs. Gantt Charts: Key Differences
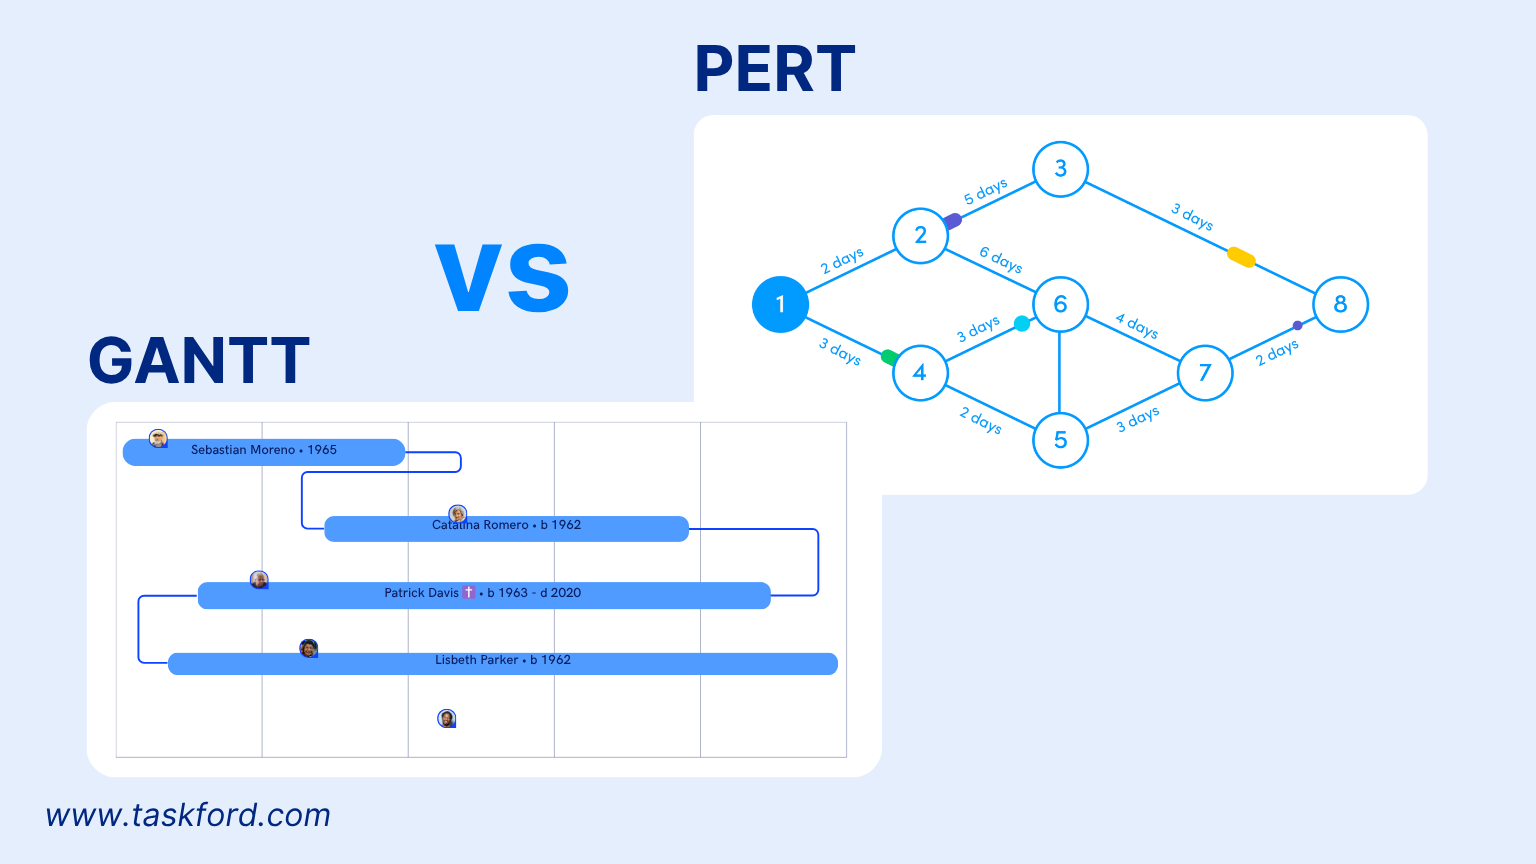
While PERT is effective for planning complex projects, PERT Chart vs Gantt Chart comparisons often arise. Here’s how they differ:
Focus:
- PERT emphasizes task dependencies and time uncertainty, using three-point estimates.
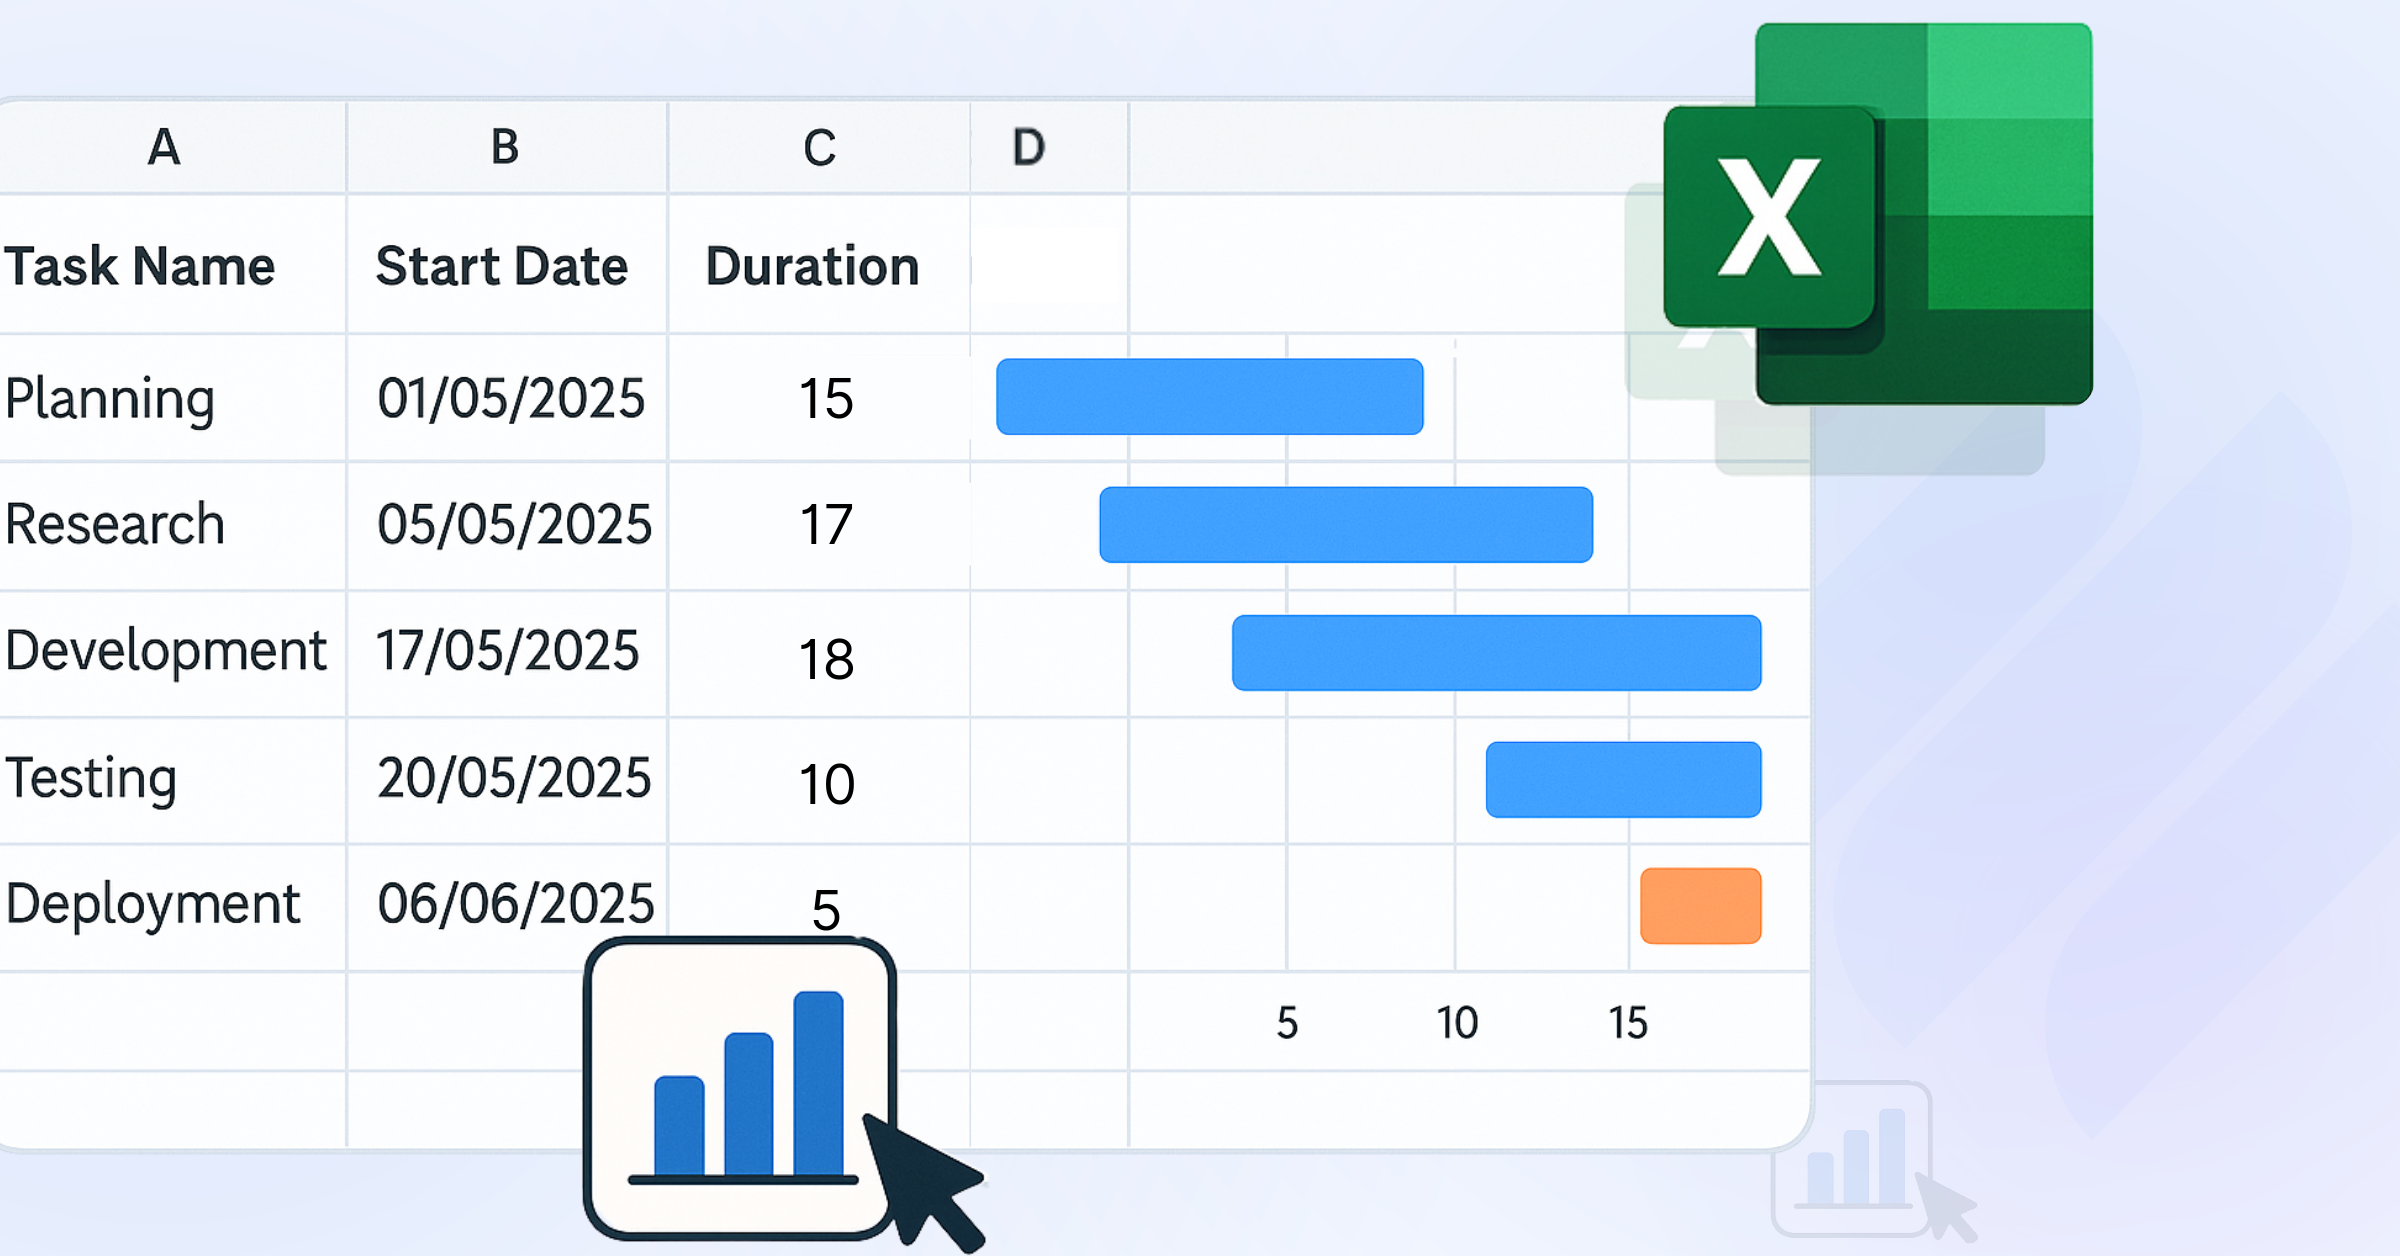
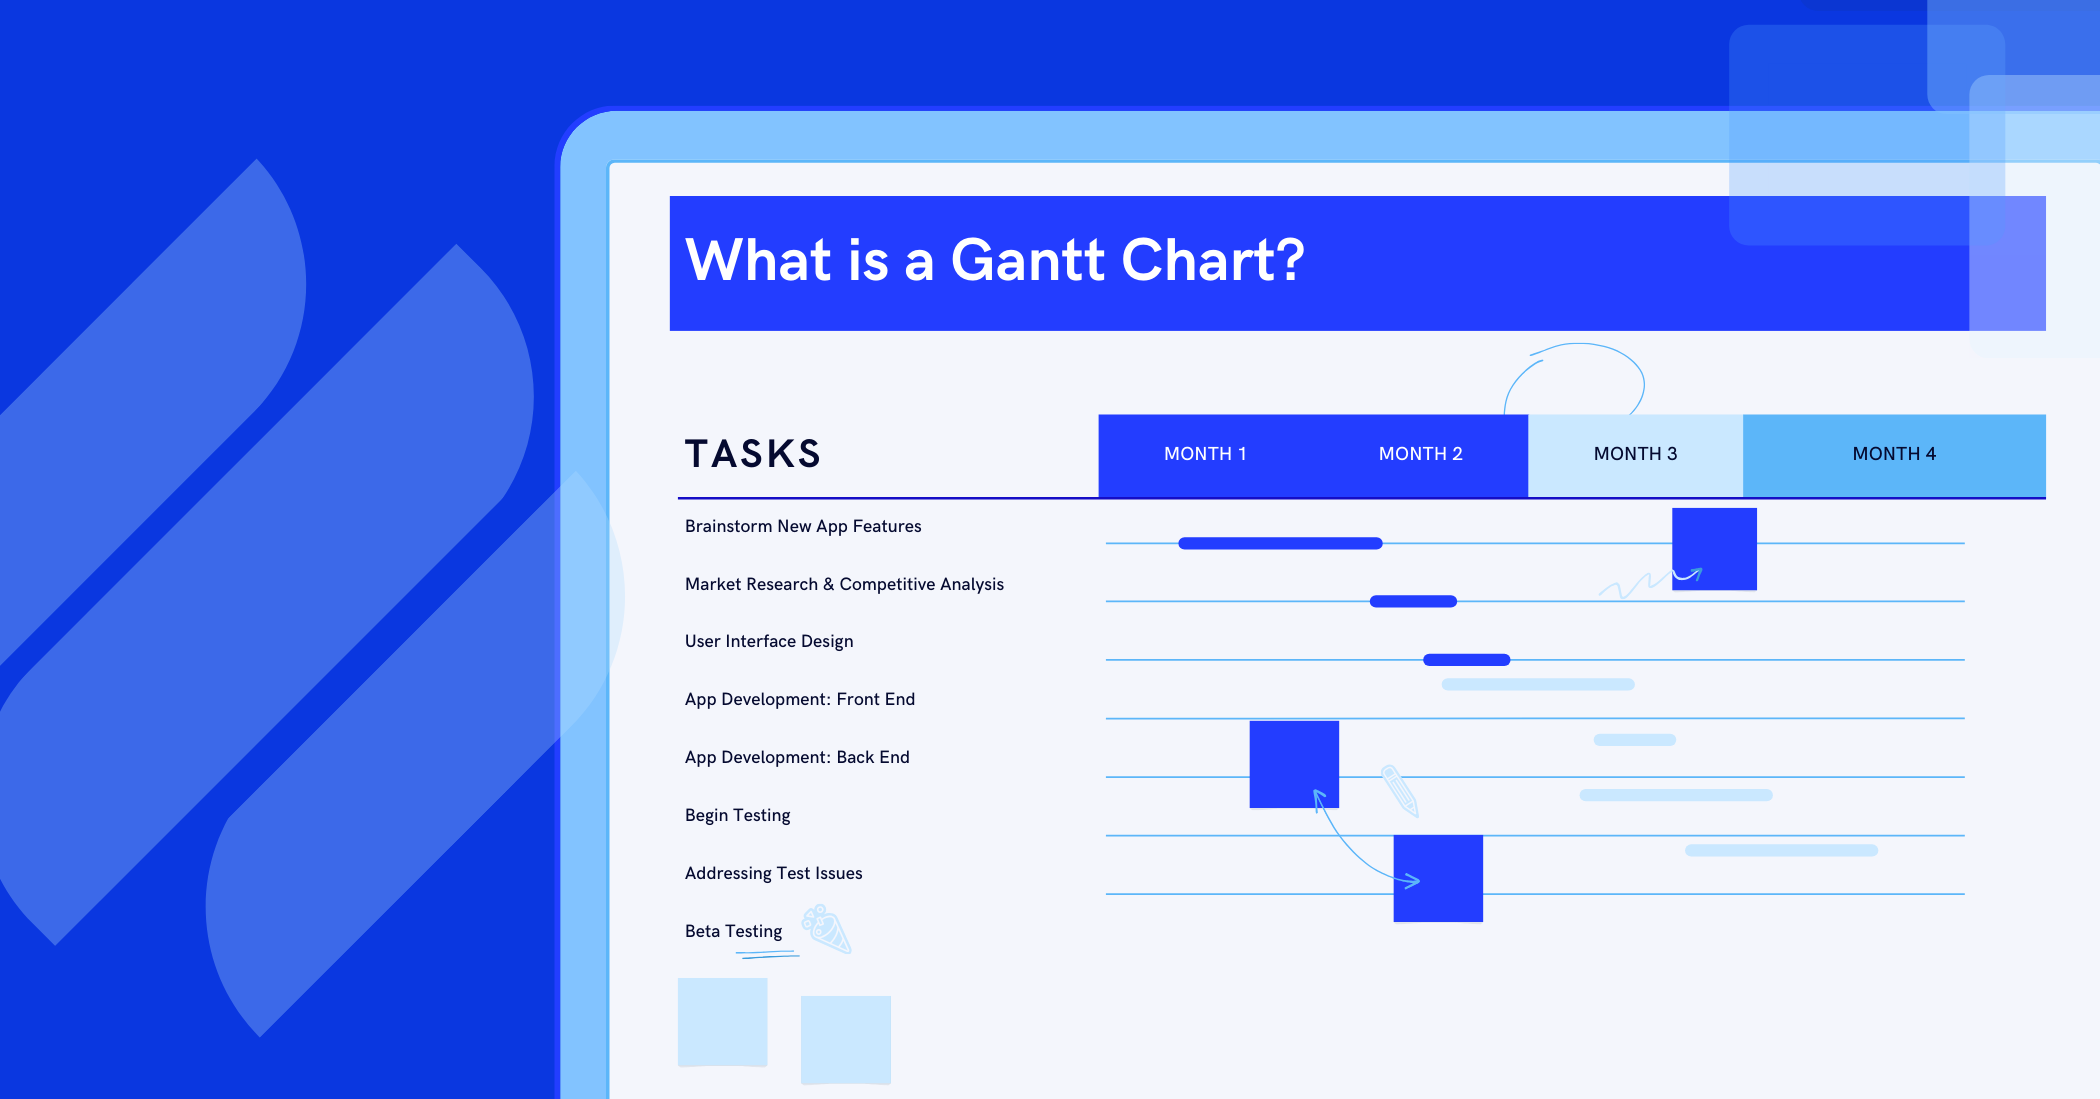
- Gantt charts focus on task timelines and progress, showing start and end dates on a linear timeline.
Visualization:
- PERT charts use nodes and arrows to map dependencies, making them ideal for complex workflows.
- Gantt charts use horizontal bars to show task durations and overlaps, better for straightforward schedules.
Use Cases:
- PERT suits projects with high uncertainty, like R&D or new product launches.
- Gantt charts work well for projects with fixed timelines, like event planning or marketing campaigns.
When to Choose: Use PERT when tasks have variable durations or complex dependencies. Opt for Gantt charts for simpler projects where visualizing progress is key.
PERT vs. CPM: Which Is Right for Your Project?
Another common comparison is PERT vs. CPM in project management. The Critical Path Method (CPM) shares similarities with PERT but has distinct features.
Key Differences
| Aspect | PERT | CPM |
|---|---|---|
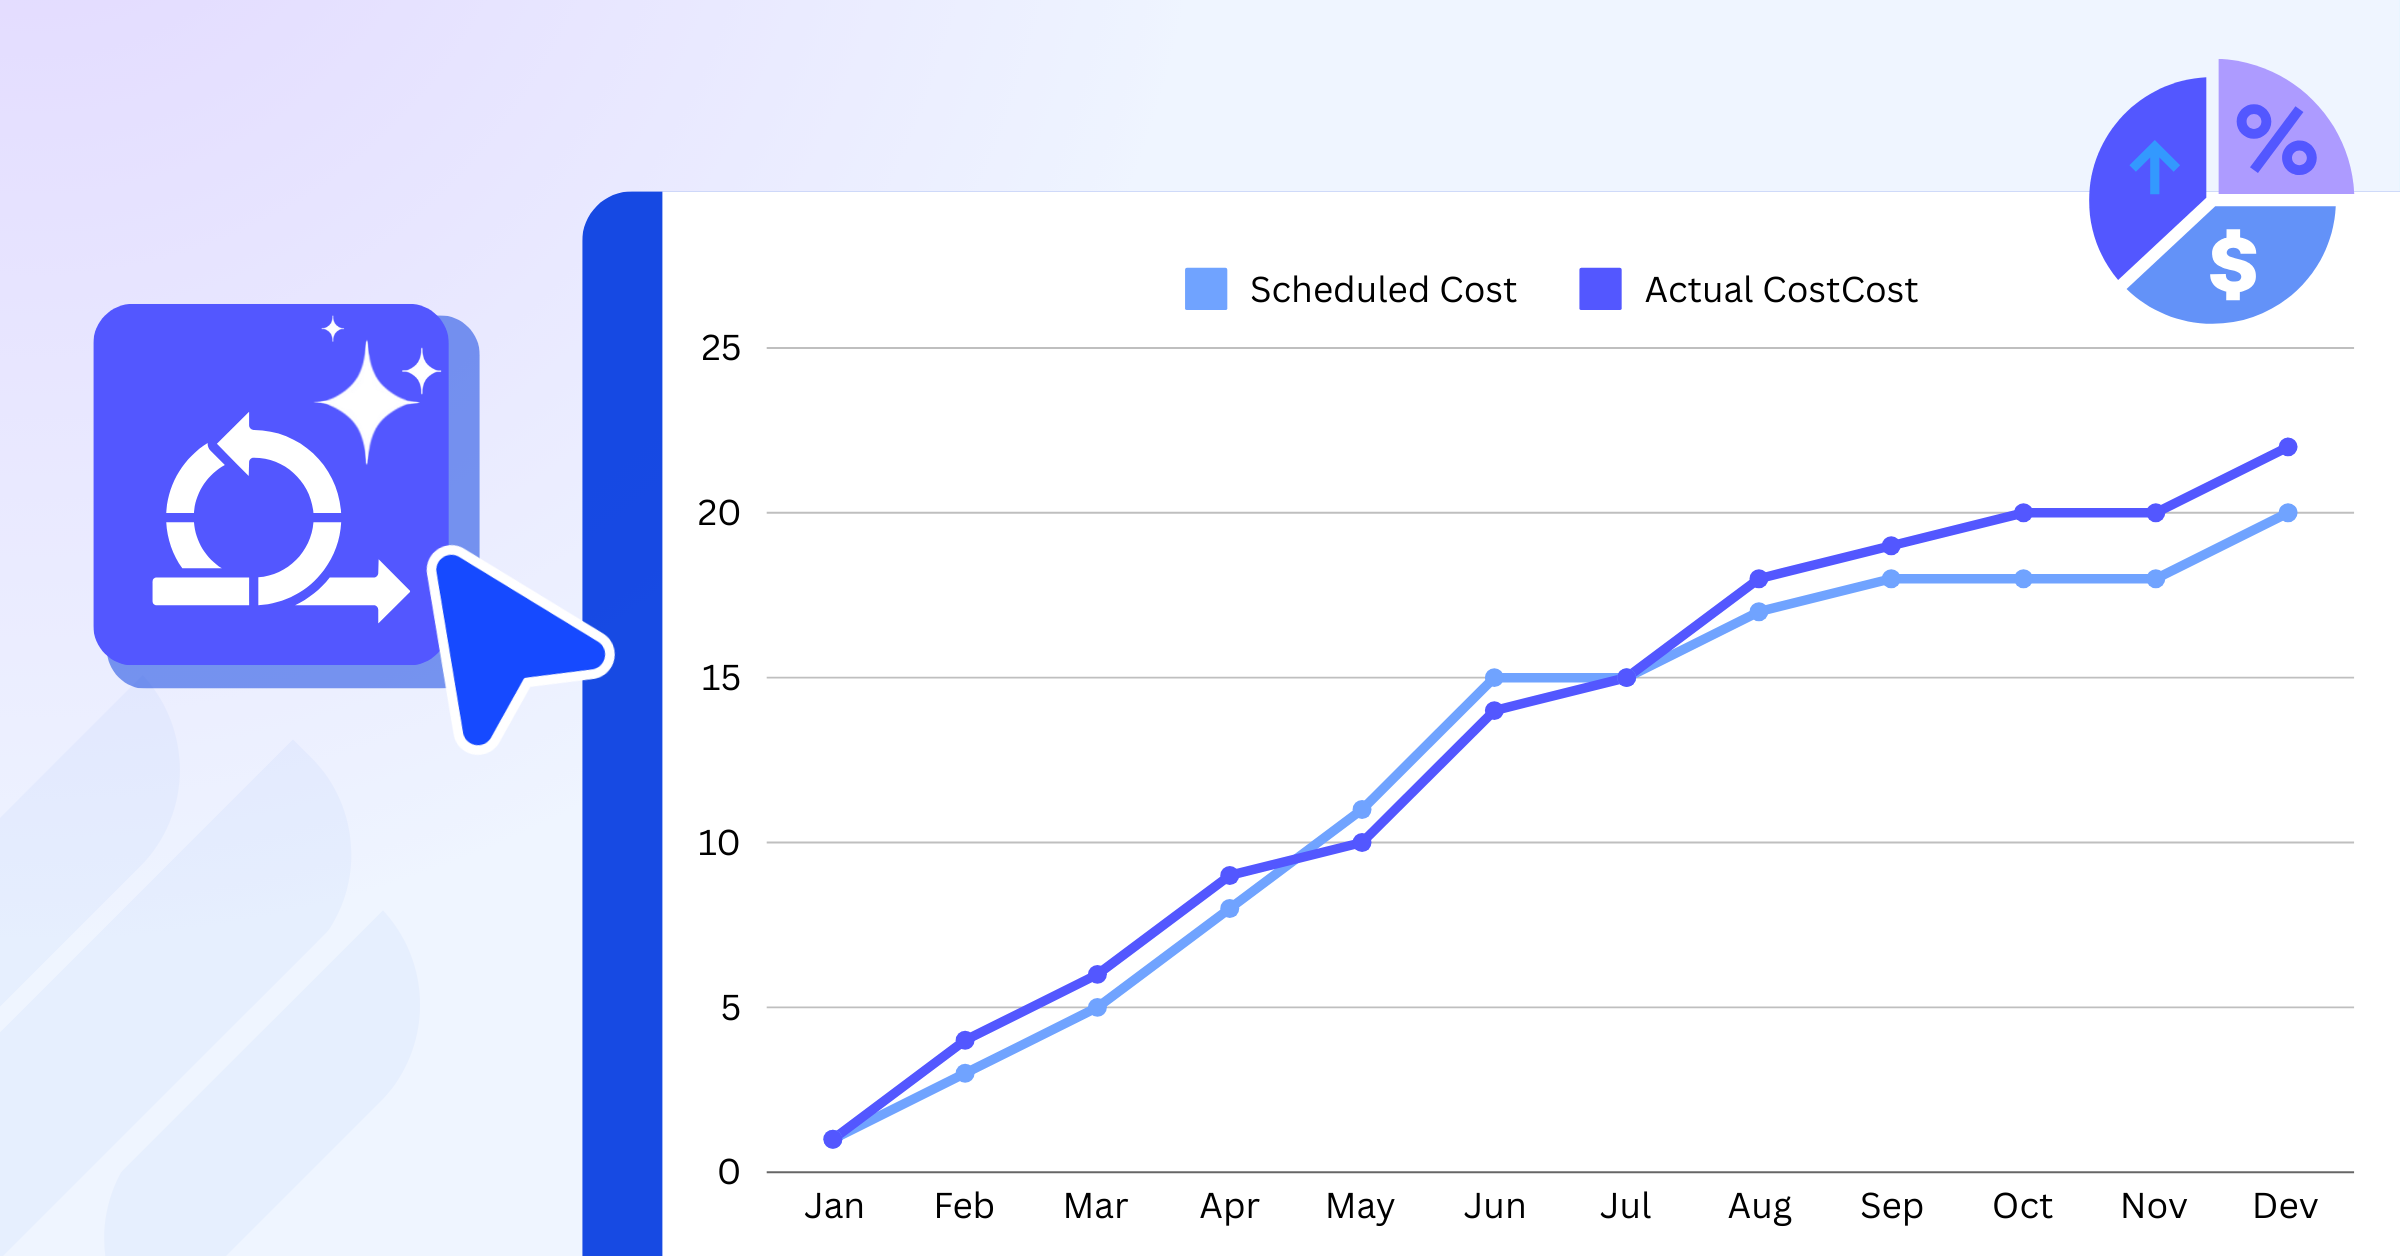
| Focus | Time estimation with uncertainty | Time and cost optimization |
| Time Estimates | Three estimates (O, M, P) | Single, deterministic estimate |
| Use Cases | R&D, software, innovative projects | Construction, manufacturing projects |
| Complexity | Handles uncertainty well | Assumes predictable task durations |
When to Use Each
- PERT: Choose for projects with unpredictable tasks, like developing a new app where testing times vary.
- CPM: Use for projects with known durations and costs, like building a bridge with fixed labor and material costs.
Example: A construction project manager used CPM to optimize costs for a highway project with clear timelines. Conversely, a biotech team used PERT for a drug trial, where testing phases had uncertain durations.
*Learn more: Critical Path Method in Project Management
Benefits of PERT in Project Management
PERT offers several advantages for project managers tackling complex projects:
- Accurate Time Estimates: The three-point estimation accounts for best-case, worst-case, and likely scenarios, reducing surprises.
- Clear Critical Path: Identifying the critical path helps prioritize tasks that directly impact the project’s timeline.
- Better Risk Management: By highlighting dependencies, PERT helps spot potential bottlenecks early.
- Improved Team Alignment: Visual charts make it easier to communicate plans to stakeholders and teams.
Challenges of Using PERT (and How to Overcome Them)
While powerful, PERT has challenges that project managers should address:
Challenge 1: Inaccurate Estimates Problem: Optimistic or pessimistic estimates may be skewed without data. Solution: Use historical project data or consult team members for realistic inputs.
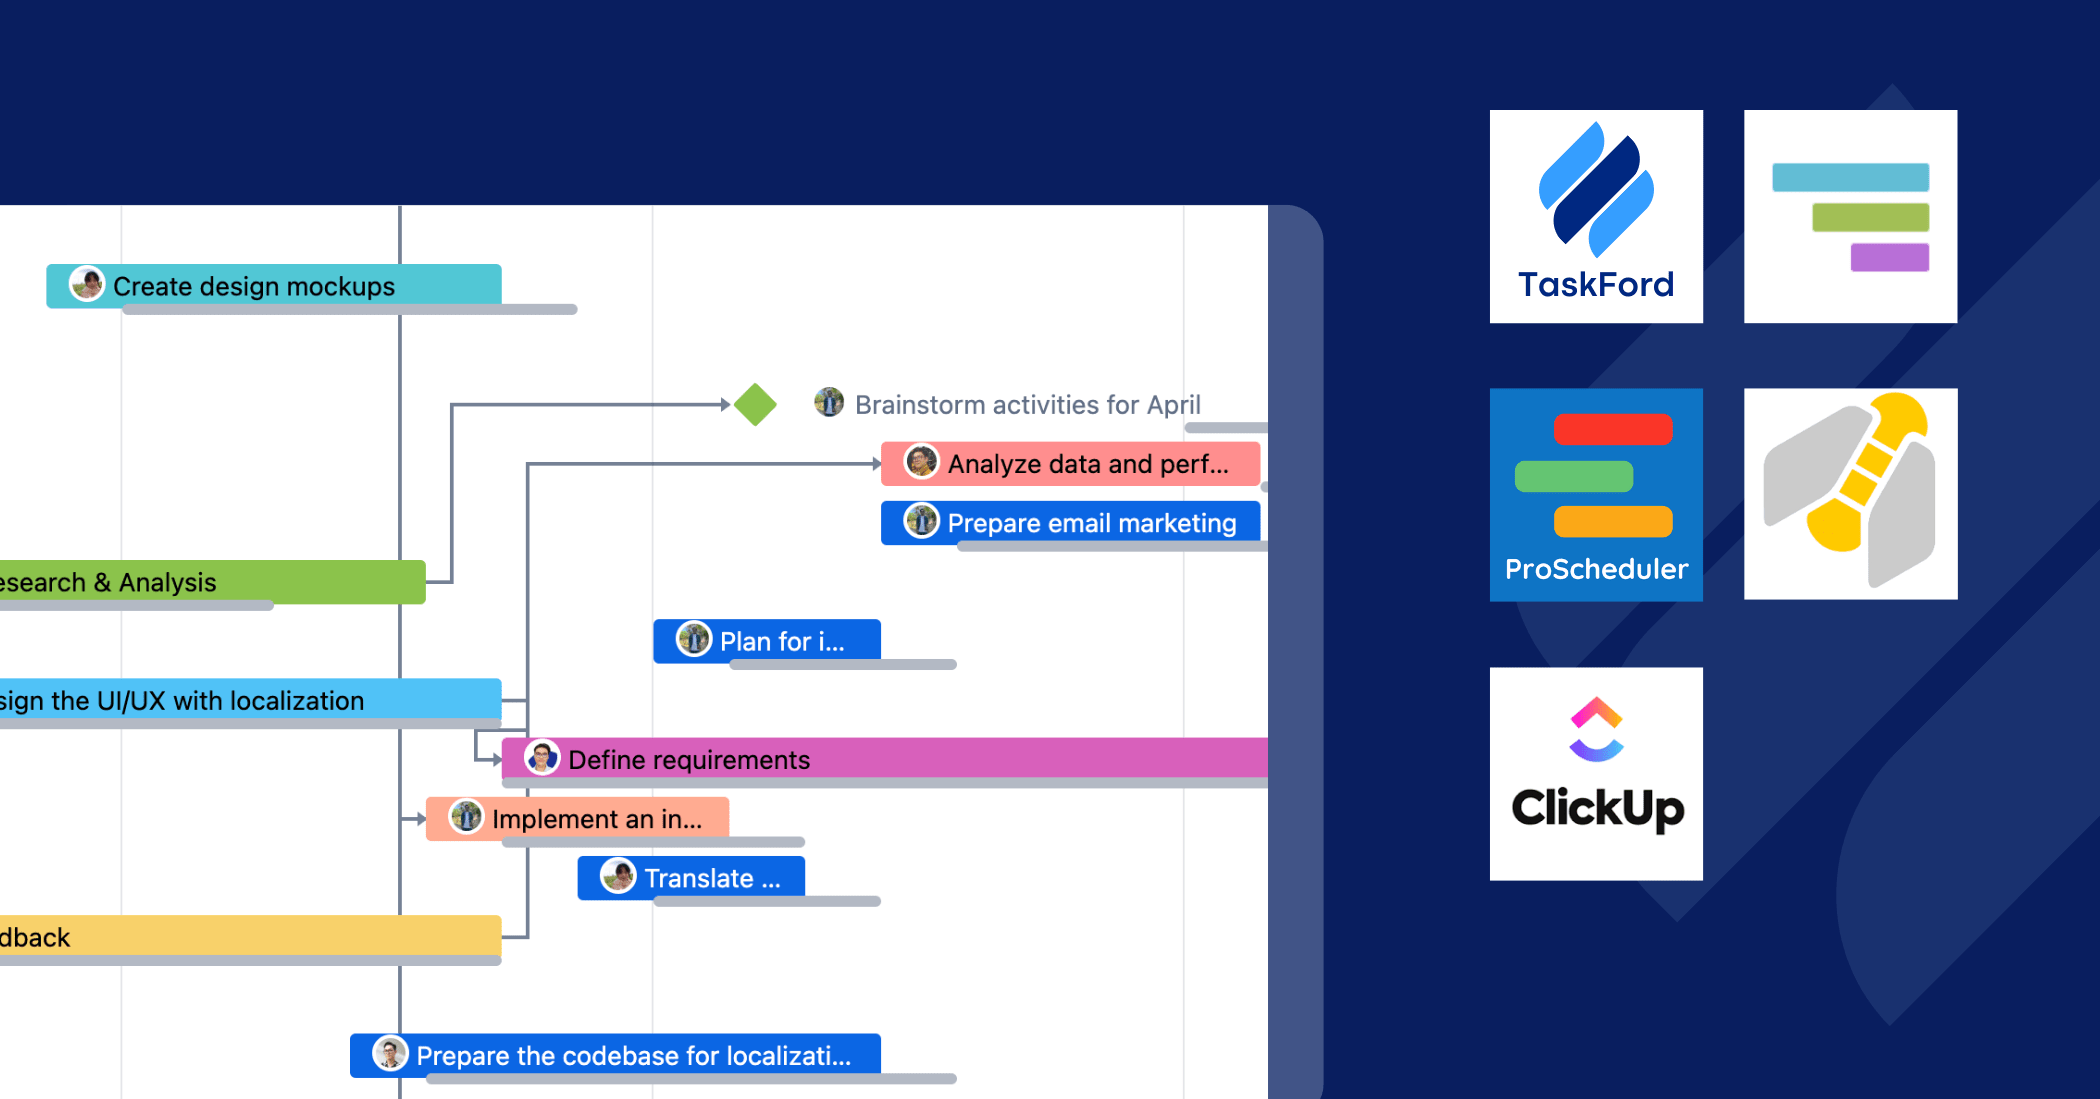
Challenge 2: Complex Charts Problem: Large projects can produce cluttered PERT charts, confusing teams. Solution: Use software like Microsoft Project or Lucidchart to simplify chart creation.
Challenge 3: Team Resistance Problem: Teams may resist learning PERT due to its perceived complexity. Solution: Train teams with simple examples and show how PERT saves time.
Real-World Case Study: PERT in a Software Project
A mid-sized tech company faced delays in launching a customer relationship management (CRM) tool. The project manager used PERT to map out tasks like “database integration” and “user interface testing.” By calculating expected times (e.g., TE for testing = (4 + 4*6 + 10) / 6 = 6.33 days), the team identified the critical path, which included testing and bug fixes. Allocating extra developers to these tasks cut the project timeline from 10 months to 8 months—a 20% time saving. The PERT chart also clarified dependencies for stakeholders, improving buy-in.
5 Practical Tips for Mastering PERT
- Start Small: Test PERT on a small project to build confidence before applying it to complex ones.
- Use Software: Automate calculations and updates with tools to save time.
- Involve Your Team: Gather input from team members for accurate time estimates.
- Review Regularly: Update the PERT chart weekly to reflect actual progress.
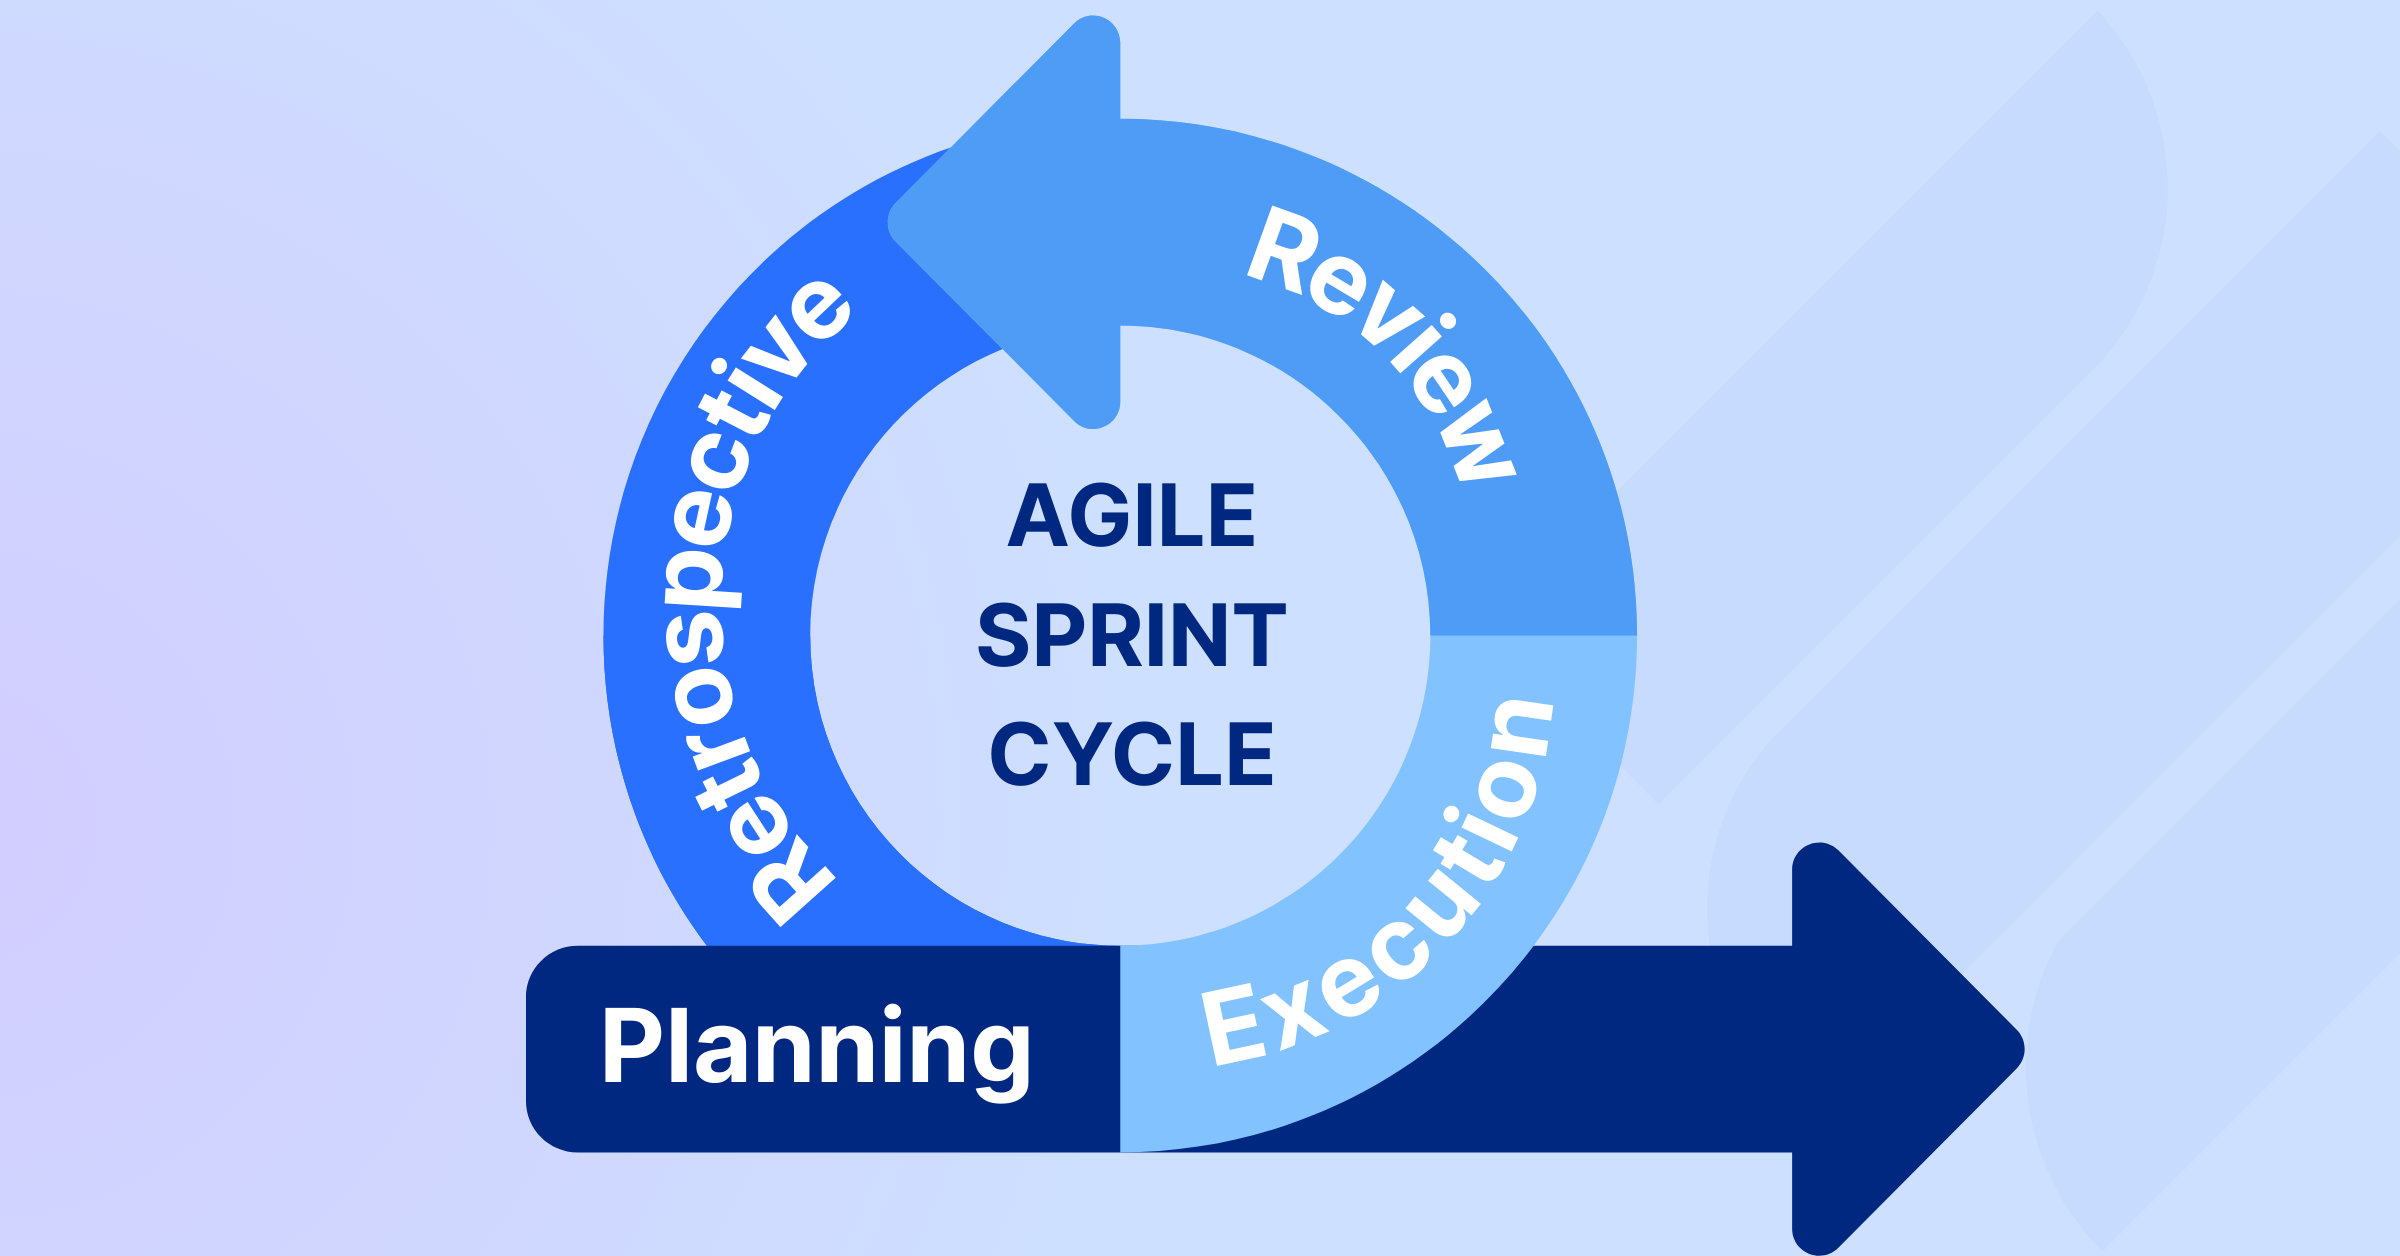
- Combine with Other Methods: Use PERT alongside Agile or Gantt charts for hybrid project management.
Conclusion: Take Control of Your Projects with PERT
PERT in project management is a powerful tool for tackling uncertainty, prioritizing tasks, and delivering projects on time. By using three-point estimates and mapping the critical path, PERT helps project managers navigate complex projects with confidence. Compared to Gantt charts and CPM, PERT excels in scenarios with unpredictable timelines, making it ideal for R&D, tech, or innovative projects. Start applying PERT today and explore more with our project management guide to streamline your workflow and reduce delays.

Making work simpler,
smarter, and more connected
Join our waitlist and be notified first.


![How to Create a Project Communication Plan: Step-by-Step Guide [+Free Template]](https://taskford.com/marketing/blog/project-communication-plan.png)


![Master Project Procurement Management in 5 Steps [Download a free plan template]](https://taskford.com/marketing/blog/project-procurement-management.webp)


![RACI Chart in Project Management: Rules & Examples [Free Download]](https://taskford.com/marketing/blog/raci-chart.webp)


Subscribe for Expert Tips
Unlock expert insights and stay ahead with TaskFord. Sign up now to receive valuable tips, strategies, and updates directly in your inbox.