How to Use S-Curve in Project Management for Cost and Schedule Control
Learn how to use S-curves in project management to control costs and schedules effectively. This guide covers creating, analyzing, and updating S-curves to track progress and forecast outcomes.
Managing a project often comes down to two core challenges: staying within budget and finishing on time. While there are many techniques available to monitor these factors, one of the most reliable and widely used tools is the S-curve in project management.
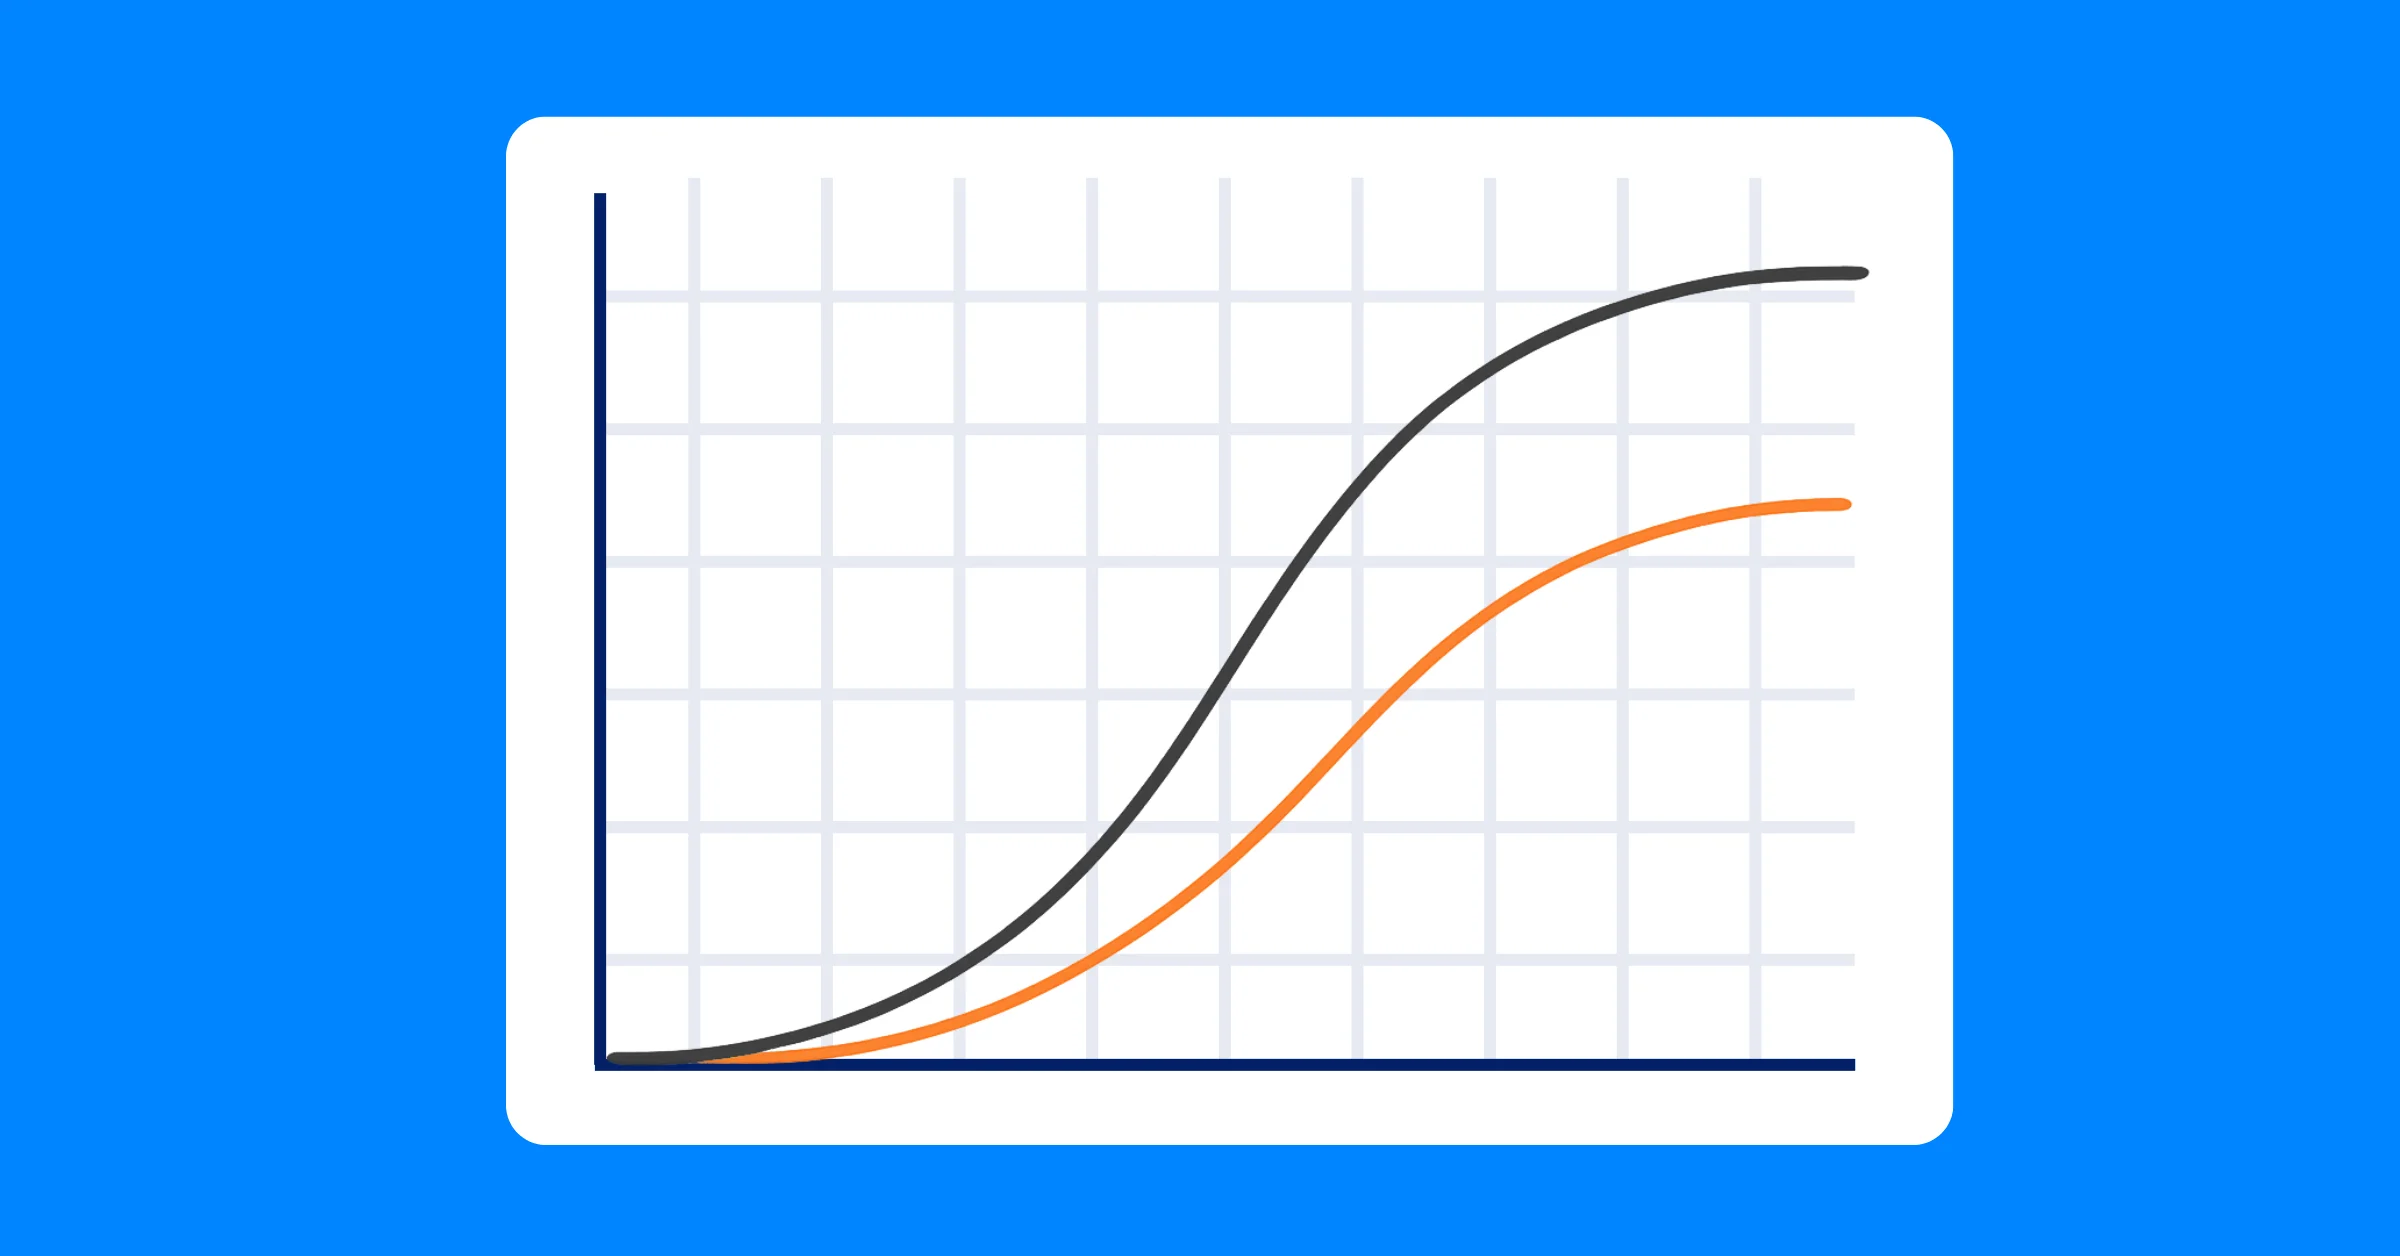
An S-curve provides a visual representation of progress, costs, or resources plotted against time. The name comes from its distinctive shape: projects typically start slowly, accelerate during execution, and then slow down again as they near completion. For project managers, this curve becomes an essential dashboard for understanding whether a project is running as expected.
In this article, we’ll explore what the S-curve is, how it’s used for cost and schedule control, and why it remains a practical tool for ensuring project success.
What Is an S-Curve in Project Management?

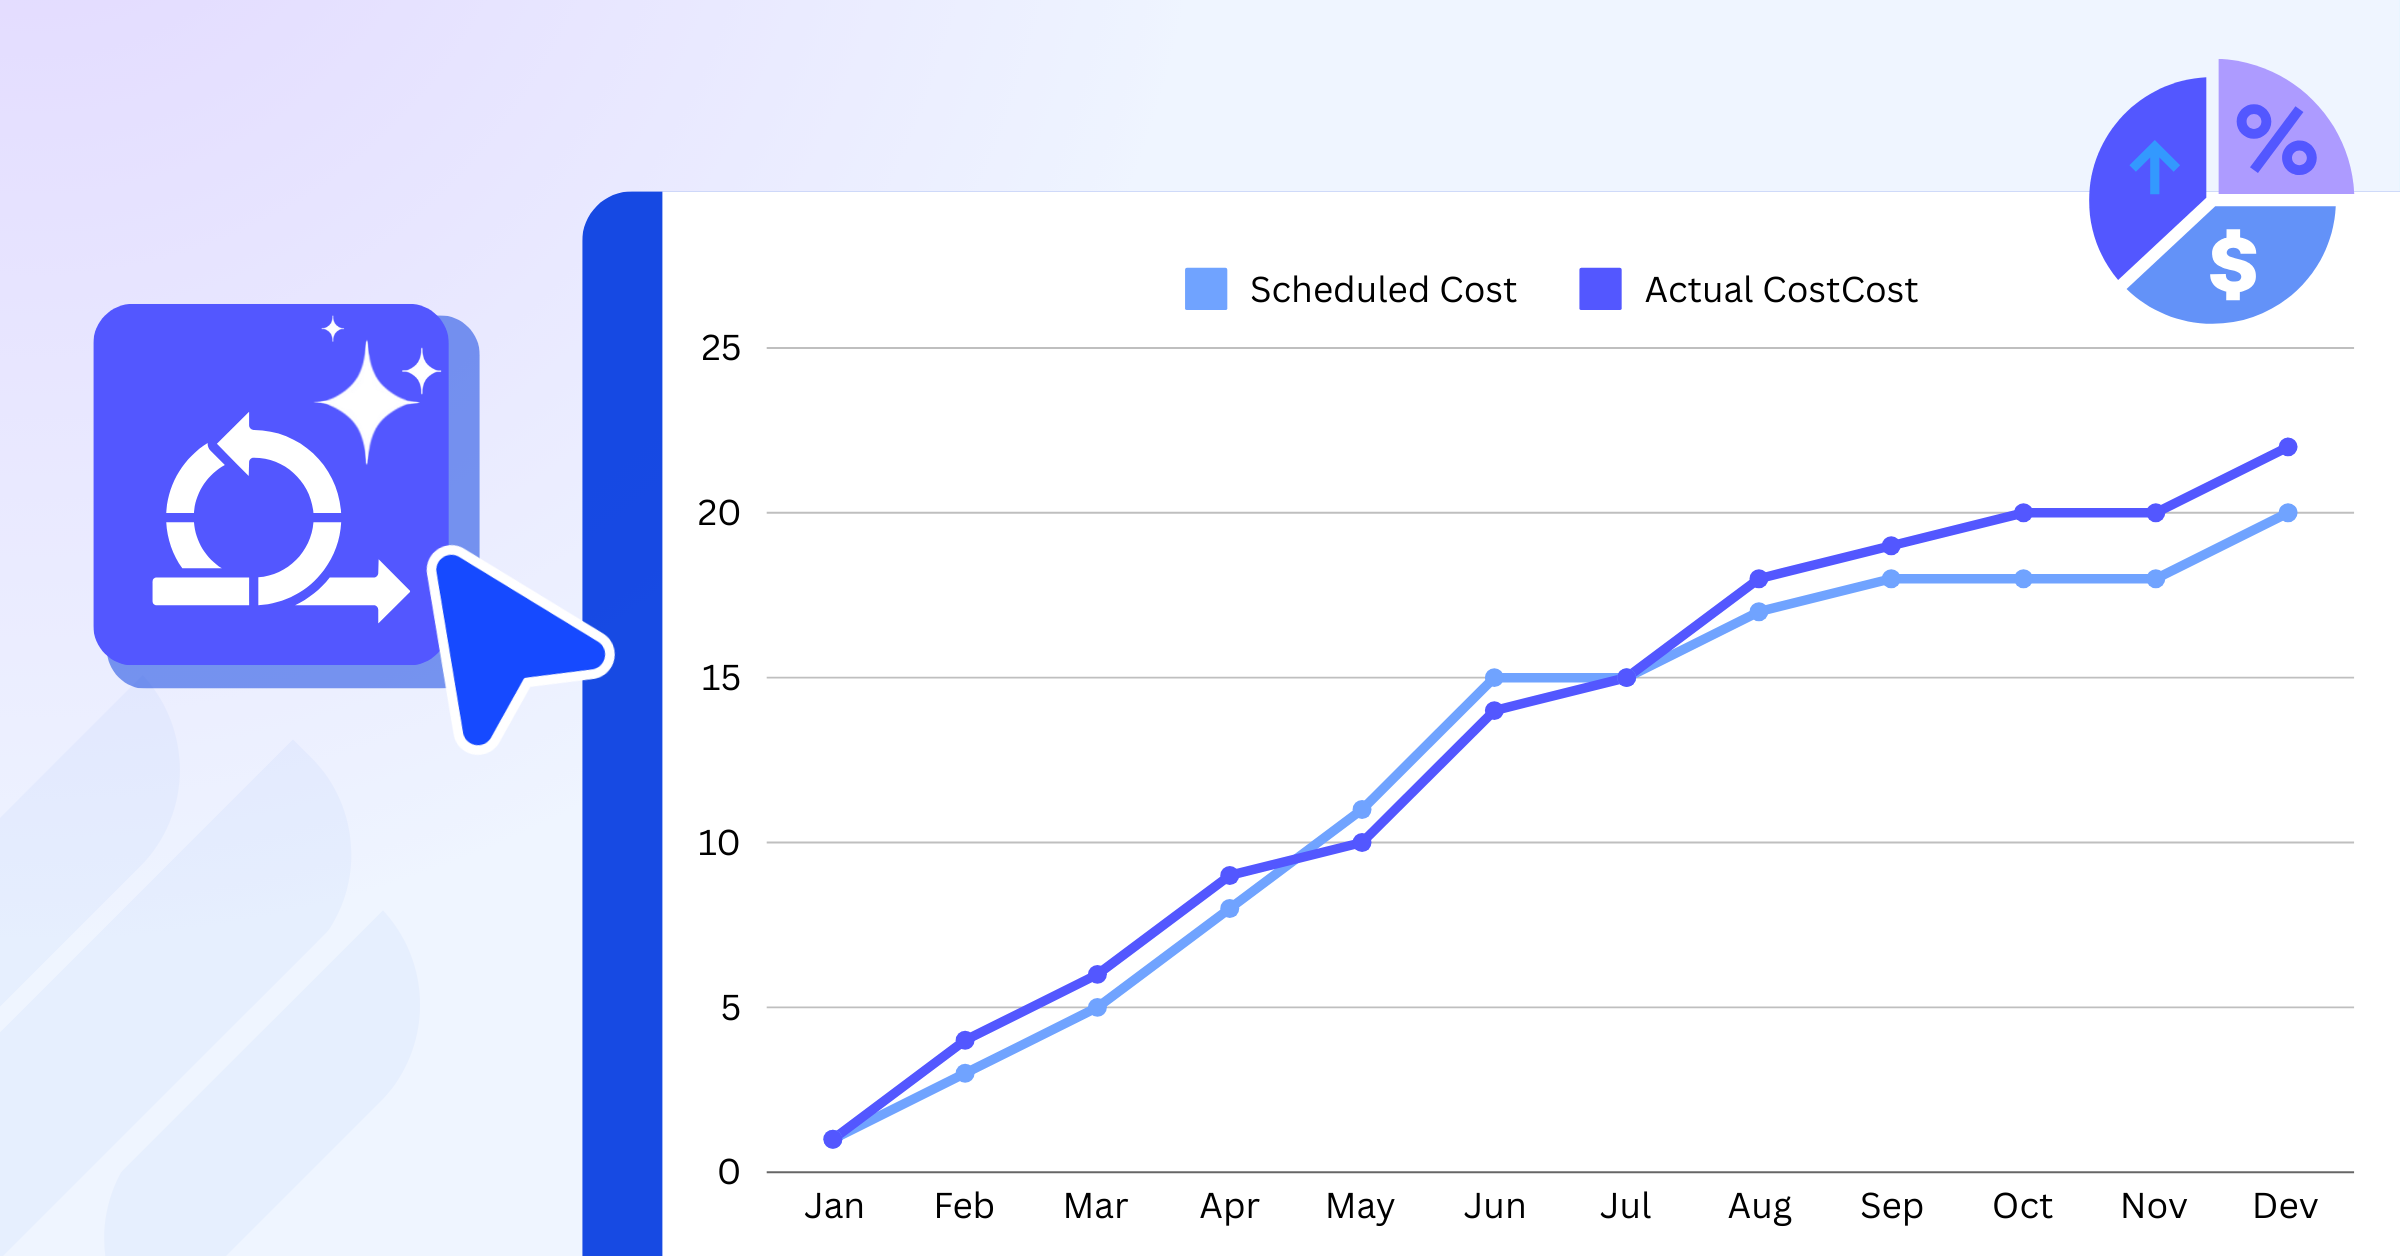
An S-curve is a graphical representation used in project management to show cumulative progress over time. It plots data points like total costs incurred or percentage of work completed against the project timeline. The curve starts flat during the initial planning phase, rises steeply during the execution phase when most work happens, and levels off as the project nears completion.
S-curves are rooted in earned value management (EVM), a method that integrates scope, schedule, and cost. In EVM, key metrics include planned value (PV), earned value (EV), and actual cost (AC). The S-curve often displays these as lines on the same graph for comparison.
For example, the planned S-curve shows the expected cumulative progress based on the baseline schedule. The actual S-curve tracks what has really happened. Deviations between these curves signal potential problems in project cost control or schedule adherence.
Secondary terms like "S-curve tracking" or "cumulative progress curve" refer to the same idea. These tools help in forecasting and decision-making, making them essential for effective project oversight.
What is the S-Curve used for in Project Management?
The S-curve is a visual tool used to compare planned versus actual progress, costs, and resources over time. It helps project managers track performance and make adjustments as needed.
- Track Progress: Compare planned and actual progress to identify delays and take corrective actions.
- Monitor Costs: Track actual costs against planned costs to detect budget overruns early.
- Forecast Outcomes: Use updated data to predict potential project issues and adjust plans proactively.
- Resource Utilization: Monitor resource usage to ensure efficient allocation and avoid under- or overallocation.
- Assess Performance: Evaluate project performance by comparing the planned and actual curves to identify areas needing attention.
Why the S-Curve Matters for Cost and Schedule Control

Projects are often judged on three success factors: time, cost, and quality. While quality is usually measured through deliverables and stakeholder satisfaction, time and cost are easier to quantify, and that’s where the S-curve comes in.
- Cost control: By plotting planned costs against actual costs, managers can identify overruns before they escalate.
- Schedule control: By mapping planned progress against actual progress, delays become visible well before deadlines are missed.
Without this type of monitoring, project teams often realize issues too late, when corrective actions are more expensive or impossible.
Benefits of Using S-Curves for Cost and Schedule Control
S-curves offer several advantages in managing project costs and schedules.
- They provide a visual way to compare planned versus actual performance. This makes it easier to identify variances early, before they become major issues.
- For cost control, S-curves highlight if spending accelerates too quickly or lags behind. If the actual cost curve rises above the planned one, it may indicate overruns due to unexpected expenses or inefficiencies.
- On the schedule side, a delayed actual progress curve suggests the project might miss deadlines.
- By extending the actual curve based on current trends, managers can predict final costs and completion dates. This supports proactive adjustments, such as reallocating resources or revising scopes.
- S-curves also improve communication. Stakeholders can quickly grasp project status from a single graph, rather than sifting through reports. In larger projects, this clarity aids in maintaining alignment across teams.
Overall, incorporating S-curve analysis enhances accuracy in project monitoring, leading to better outcomes in cost management and schedule adherence.
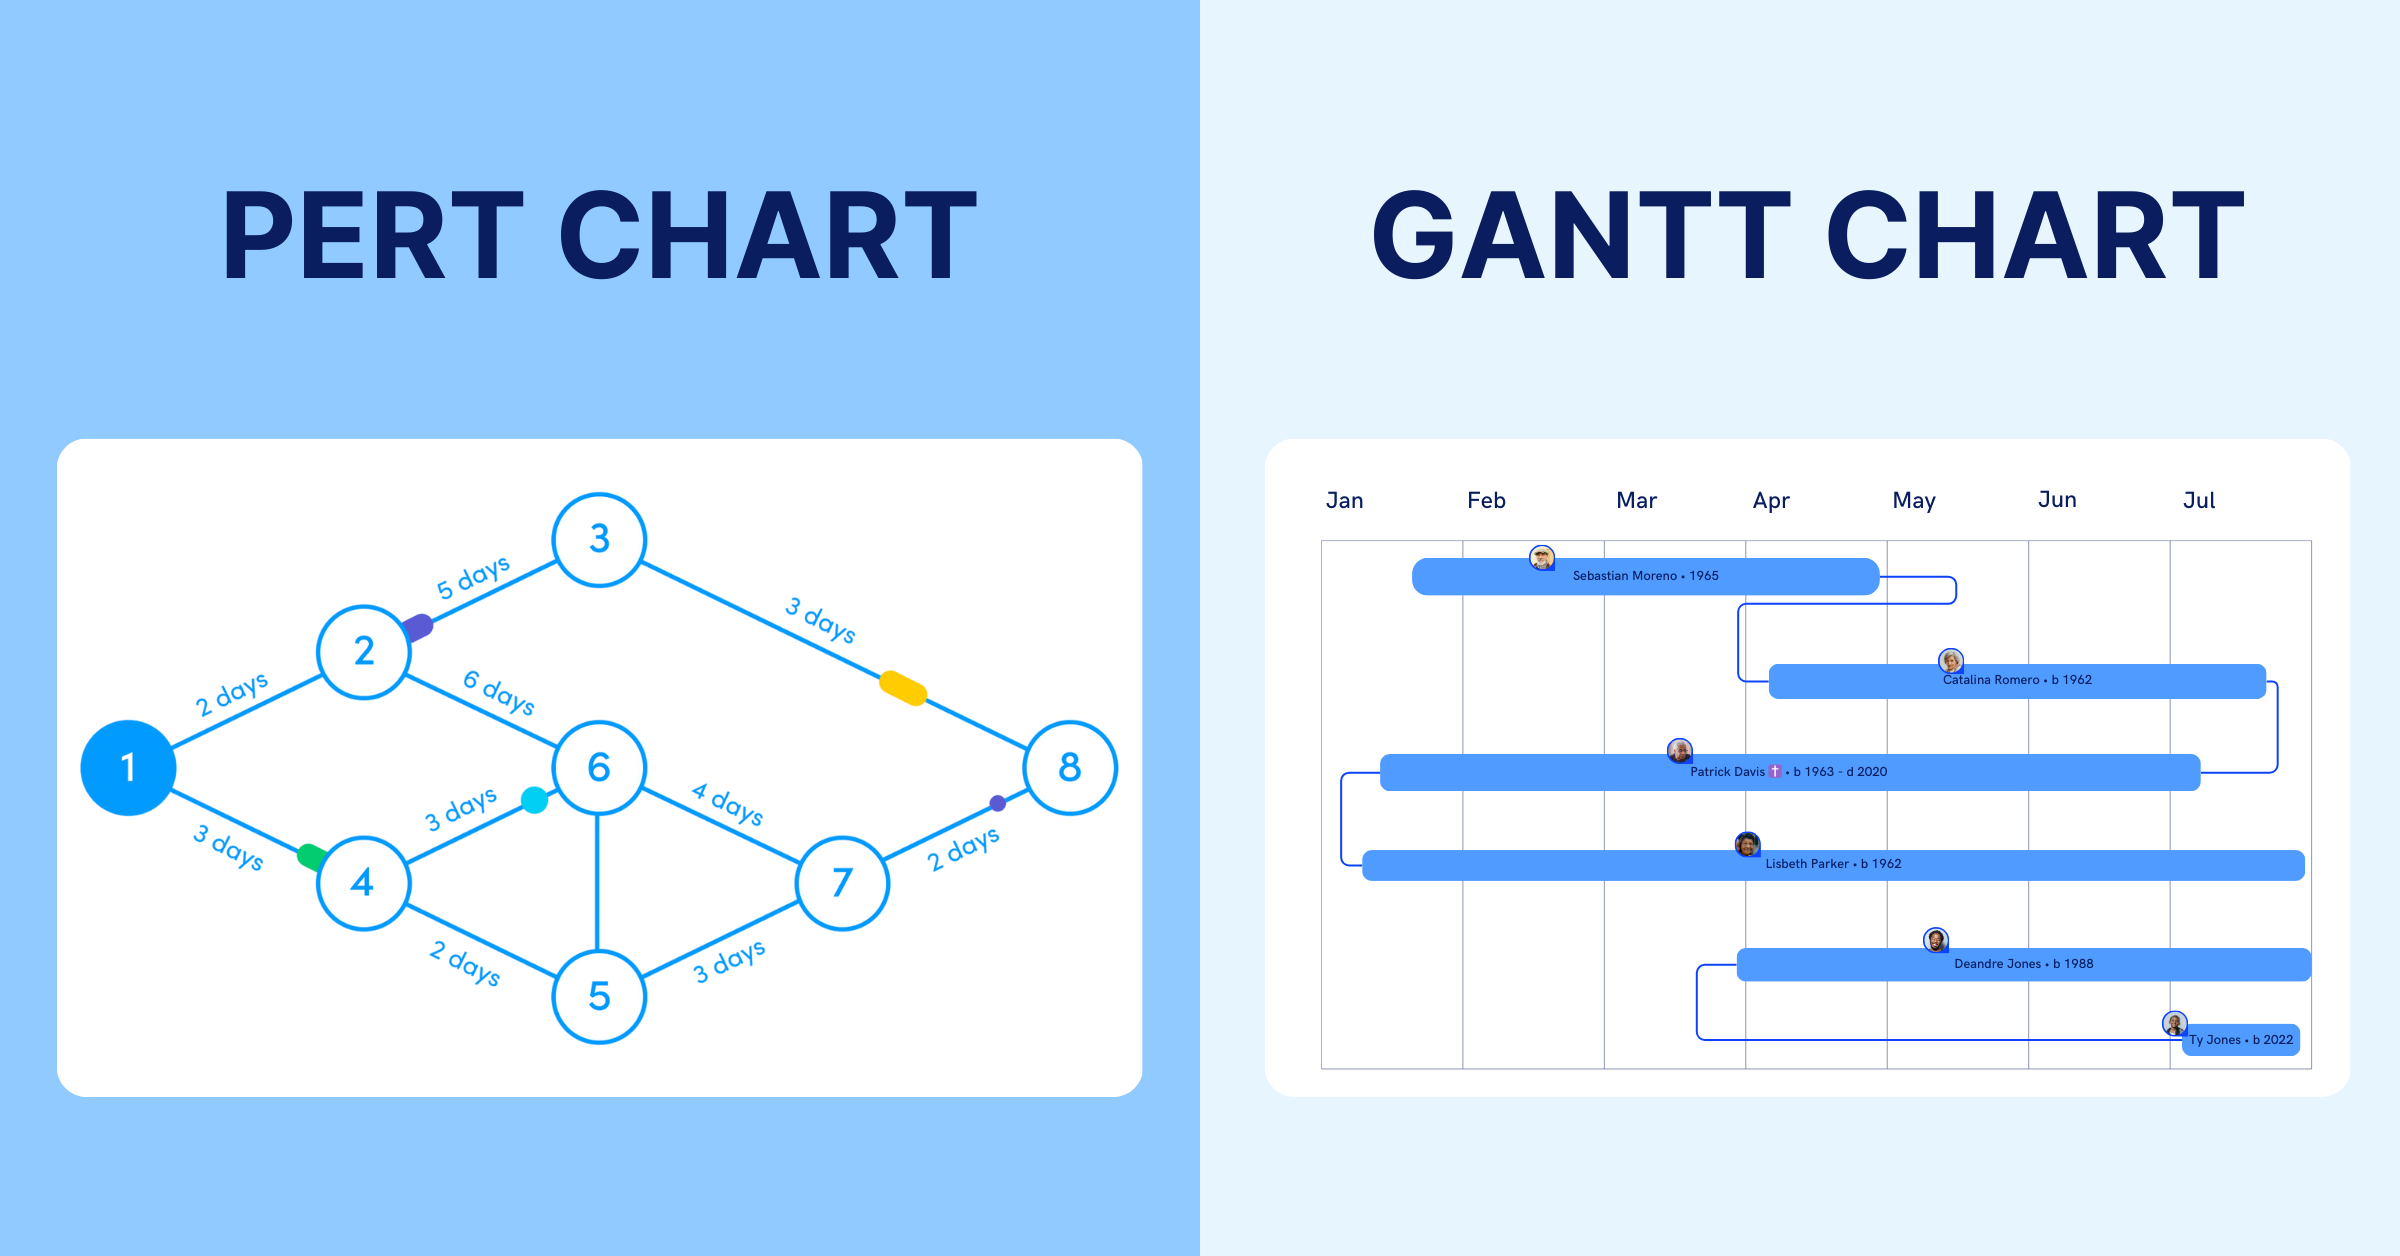
Steps to Implement an S-Curve in Project Management

Implementing an S-curve in project management requires a structured approach to ensure accurate tracking of costs and schedules. By following these steps, project managers can create a reliable S-curve to monitor progress, identify variances, and make informed decisions. Below is a detailed guide to setting up and using an S-curve effectively.
Step 1: Develop a Detailed Project Plan
The foundation of an S-curve is a comprehensive project plan. This plan should outline all tasks, their durations, resource requirements, and associated costs. Break the project into manageable work packages using a work breakdown structure (WBS). Each task should have a clear start and end date, as well as a budgeted cost.
For example, in a construction project, tasks might include site preparation, foundation work, and structural framing. Assign costs and timelines to each. This forms the baseline for your S-curve, often referred to as the planned value (PV) or budgeted cost of work scheduled (BCWS).
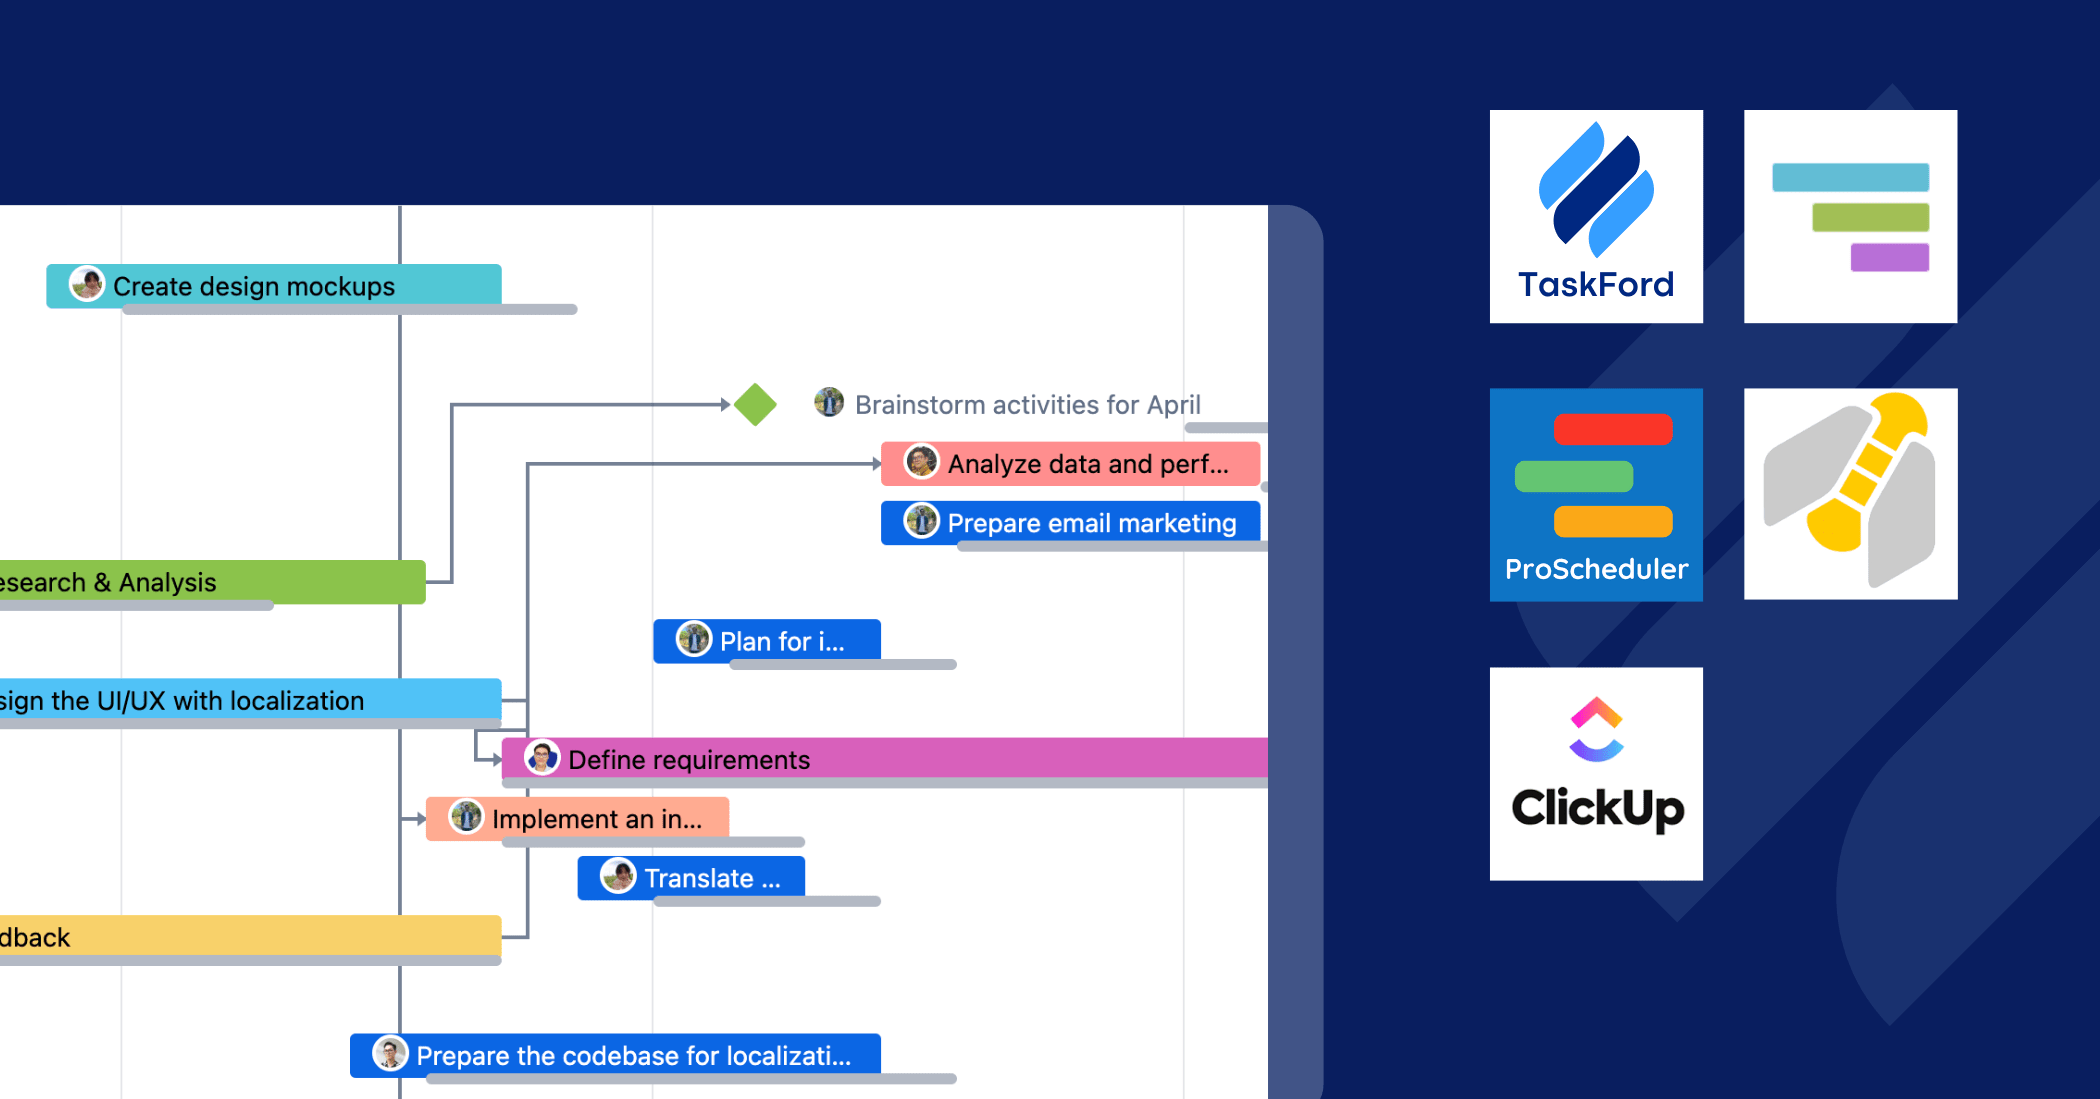
Use project management software like TaskFord, Microsoft Project, or even Excel to organize this data. Ensure the plan is realistic and approved by stakeholders to avoid frequent revisions that could distort the S-curve.
Step 2: Calculate Cumulative Planned Value
Once the project plan is ready, calculate the cumulative planned value (PV) over time. This represents the budgeted cost of work scheduled for each time period, such as weeks or months. Sum the costs of all tasks expected to be completed by each period.
For instance, if a project has a $500,000 budget over 10 months, and $50,000 worth of work is planned for the first month, the cumulative PV at month one is $50,000. By month two, if another $75,000 is planned, the cumulative PV becomes $125,000. Continue this for the entire project duration.
This cumulative data forms the planned S-curve, which serves as the baseline for comparison against actual progress.
Step 3: Track Actual Progress and Costs
As the project progresses, collect data on actual performance. This includes two key metrics:
- Earned Value (EV): The budgeted cost of work actually completed, also known as budgeted cost of work performed (BCWP). For example, if a task worth $10,000 is fully completed, the EV is $10,000, regardless of actual spending.
- Actual Cost (AC): The real expenses incurred for the work done, including labor, materials, and other costs.
Track these metrics at regular intervals, such as weekly or monthly, depending on the project’s duration and complexity. Accurate data collection is critical, so ensure team members report progress and costs consistently. Use timesheets, invoices, and project management tools to gather this information.
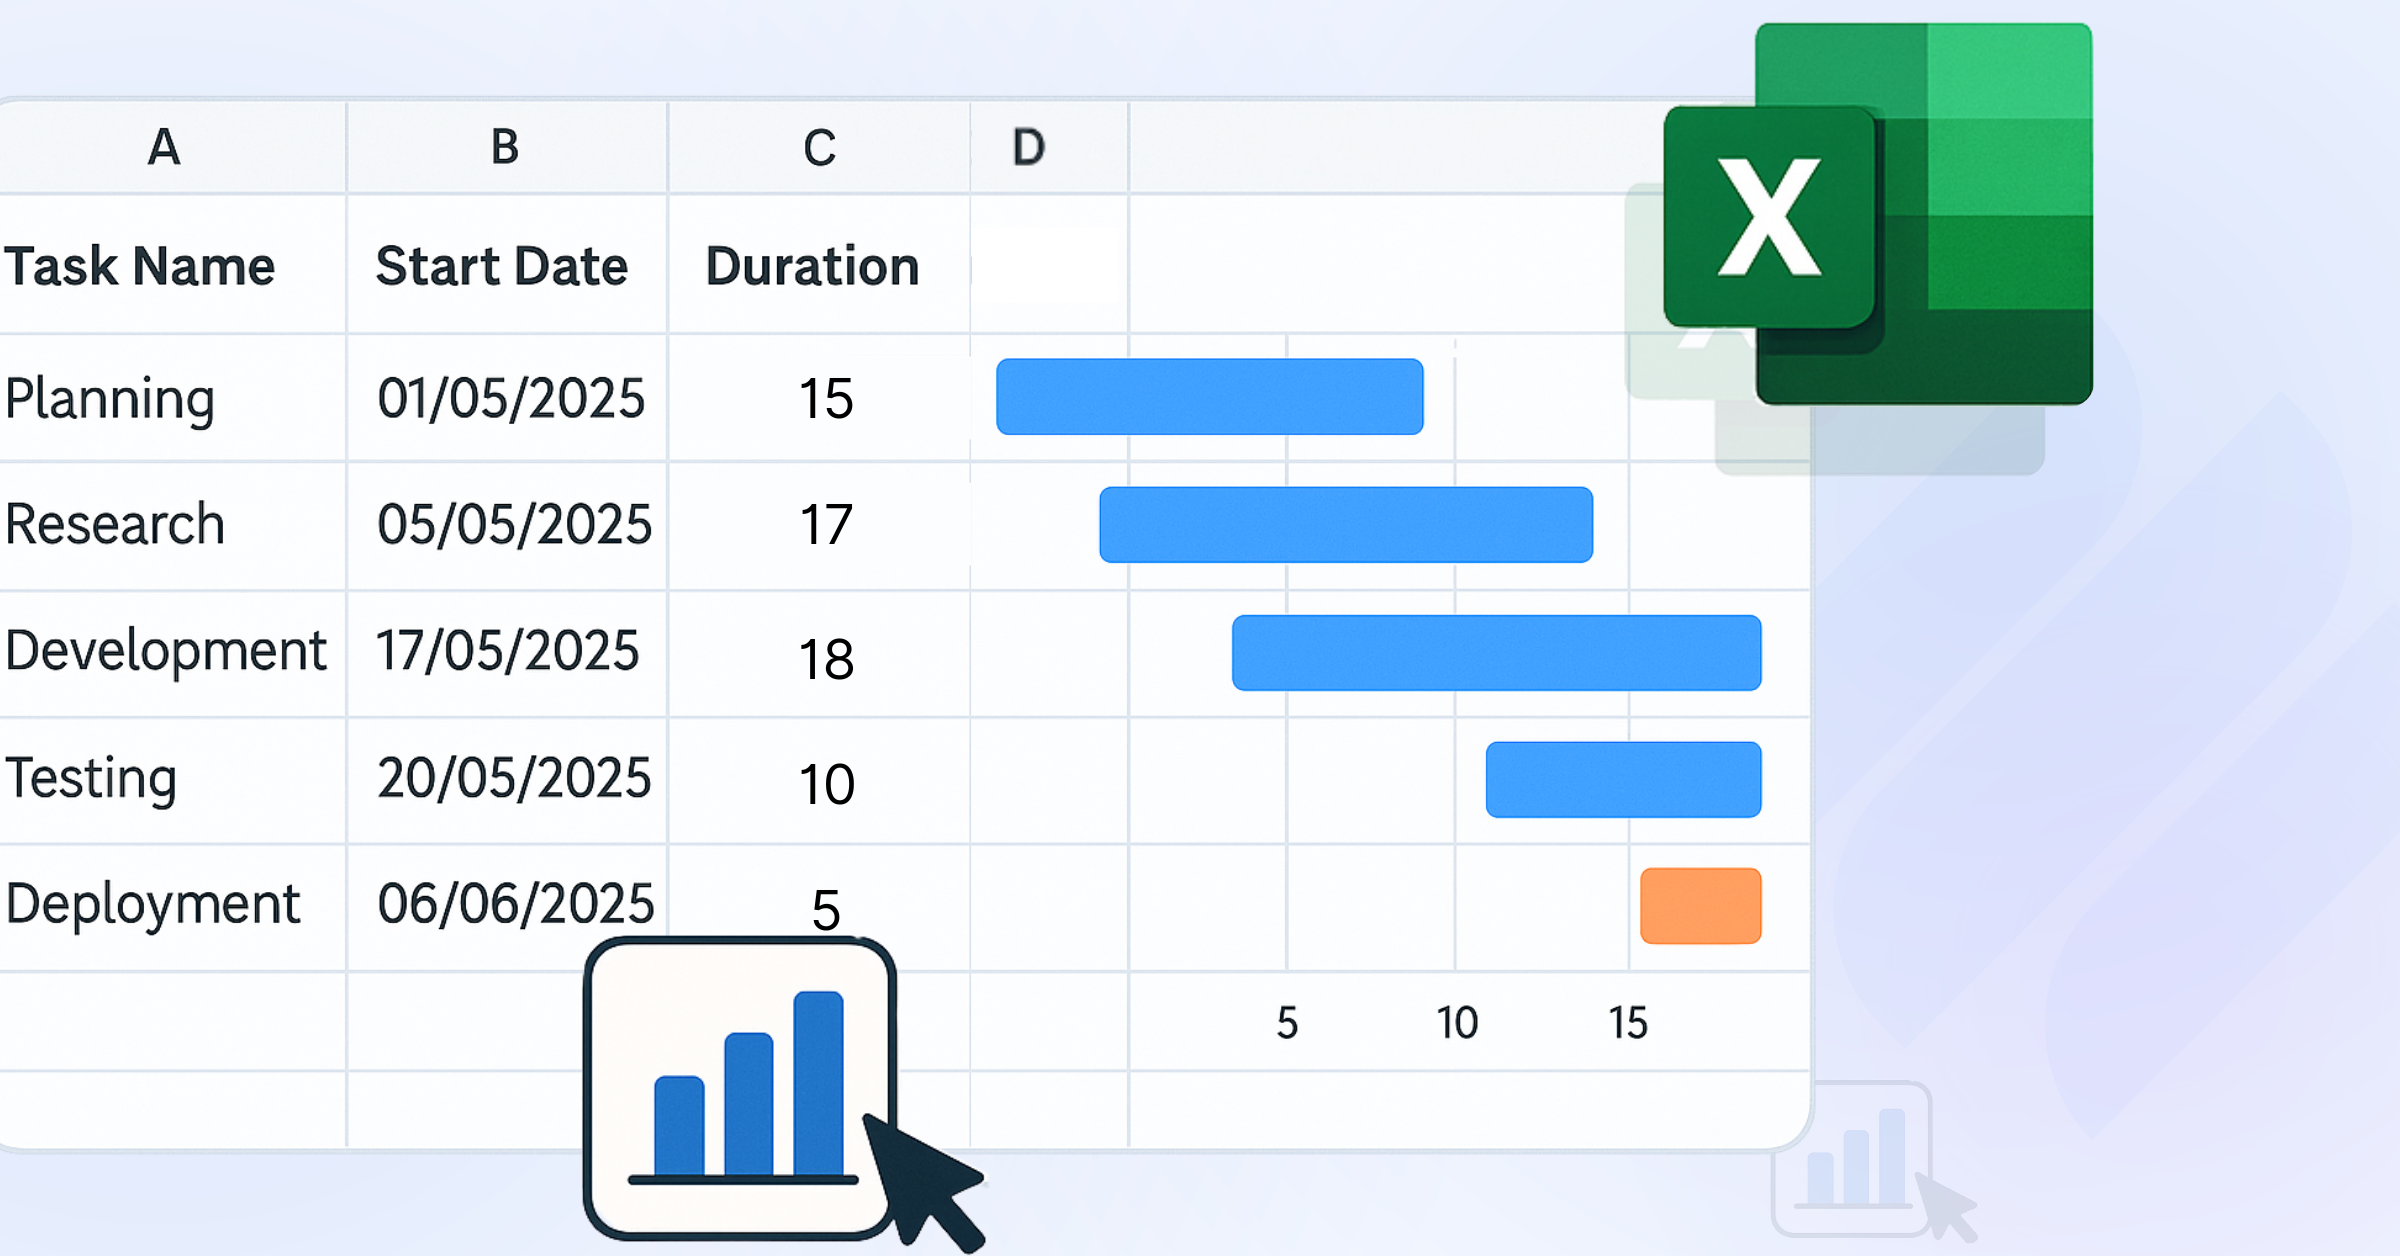
Step 4: Plot the S-Curve
With planned and actual data in hand, create the S-curve by plotting three lines on a graph:
- X-axis: Represents time (e.g., weeks, months).
- Y-axis: Represents cumulative values (e.g., dollars for costs or percentage for progress).
- Lines: Plot cumulative PV, EV, and AC over time
In Excel, input time periods in one column, followed by columns for cumulative PV, EV, and AC. Use a line chart to generate the S-curve. Alternatively, project management software can automate this process, pulling data directly from schedules and cost reports.
The resulting graph will show the planned S-curve (PV) as the baseline, with EV and AC curves reflecting actual performance. The shape typically starts flat, rises steeply during peak activity, and flattens as the project nears completion.
Step 5: Analyze Variances and Trends
Regularly compare the planned (PV) and actual (EV and AC) curves to identify variances. Key metrics include:
- Cost Variance (CV): CV = EV - AC. A negative CV indicates costs are higher than earned value, signaling potential overruns.
- Schedule Variance (SV): SV = EV - PV. A negative SV means the project is behind schedule.
- Cost Performance Index (CPI): CPI = EV / AC. A CPI below 1 suggests cost inefficiency.
- Schedule Performance Index (SPI): SPI = EV / PV. An SPI below 1 indicates schedule delays.
For example, if the EV curve lags behind PV, tasks are taking longer than planned. If the AC curve exceeds EV, spending is outpacing progress. Use these insights to pinpoint issues, such as resource bottlenecks or scope creep, and take corrective actions.
Step 6: Regular Update, Communicate, and Forecast
S-curves are not static; they require regular updates to remain relevant. Review and refresh the data at consistent intervals—weekly for fast-paced projects or monthly for longer ones. Update EV and AC based on the latest progress reports and costs.
To enhance communication, customize the S-curve for different audiences. For executives, focus on high-level trends, like overall budget status. For team leads, drill into specific task variances.
Extend EV and AC trends to forecast final costs and completion dates. For example, a CPI of 0.9 suggests a potential 10% budget overrun. Use these insights for proactive decisions, like reallocating resources, to keep the project on track.
Conclusion
S-curves are a powerful tool for project managers aiming to maintain control over costs and schedules. By visually comparing planned value (PV), earned value (EV), and actual cost (AC), S-curves reveal deviations early, enabling timely corrective actions. Their ability to track progress, monitor spending, forecast outcomes, and improve stakeholder communication makes them indispensable across industries like construction and IT. By following a structured process, building a detailed plan, calculating PV, tracking EV and AC, plotting the curve, analyzing variances, and regularly updating, managers can ensure projects stay on track.
For a deeper dive into project management fundamentals, explore What is Project Management.

Making work simpler,
smarter, and more connected
Join our waitlist and be notified first.


![Daily Standup Best Practices: Apply AI to Organize Meetings Successfully [2025 Trends]](https://taskford.com/marketing/blog/daily-standup.webp)


![How to Create a Project Communication Plan: Step-by-Step Guide [+Free Template]](https://taskford.com/marketing/blog/project-communication-plan.png)


![Master Project Procurement Management in 5 Steps [Download a free plan template]](https://taskford.com/marketing/blog/project-procurement-management.webp)


![RACI Chart in Project Management: Rules & Examples [Free Download]](https://taskford.com/marketing/blog/raci-chart.webp)


Subscribe for Expert Tips
Unlock expert insights and stay ahead with TaskFord. Sign up now to receive valuable tips, strategies, and updates directly in your inbox.